Bandhan Large Cap Fund§
Large Cap Fund- An open ended equity scheme predominantly investing in large cap stocks

Bandhan Large Cap Fund§
Large Cap Fund- An open ended equity scheme predominantly investing in large cap stocks
|
|
|
|
|

|


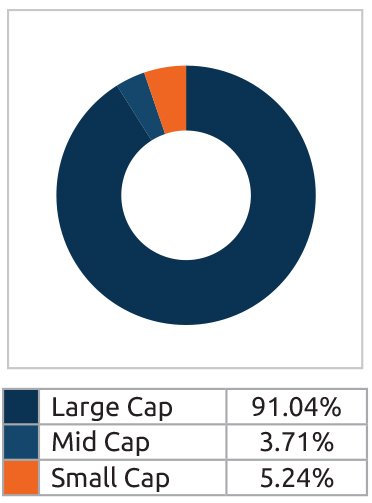
About the Fund: • A Large Cap fund with opportunistic mid/small cap allocation up to 20%
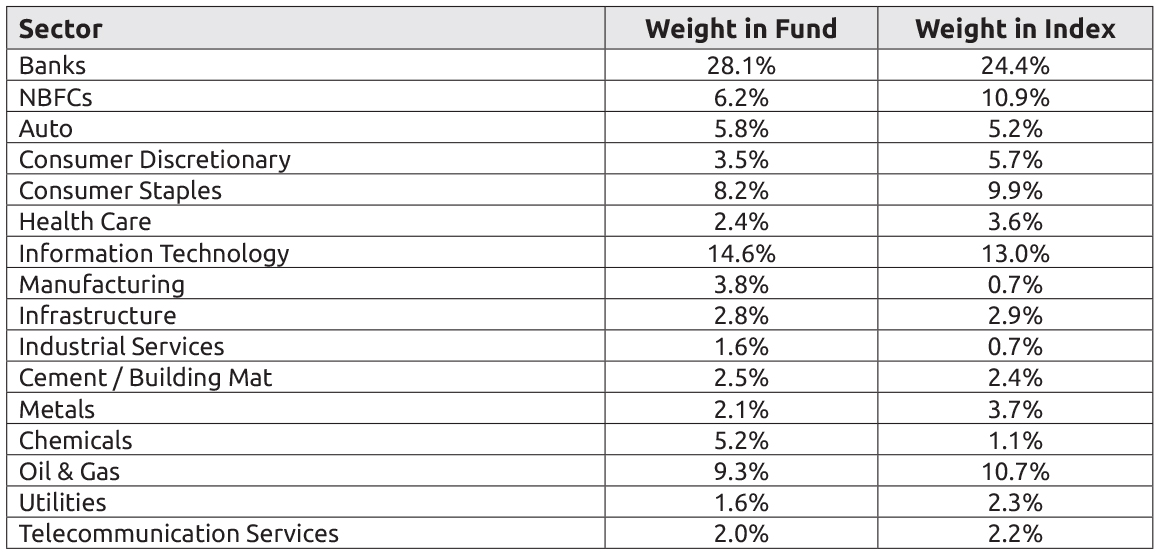
• Focuses on investing in the right sectors as well investing in sector leader companies.
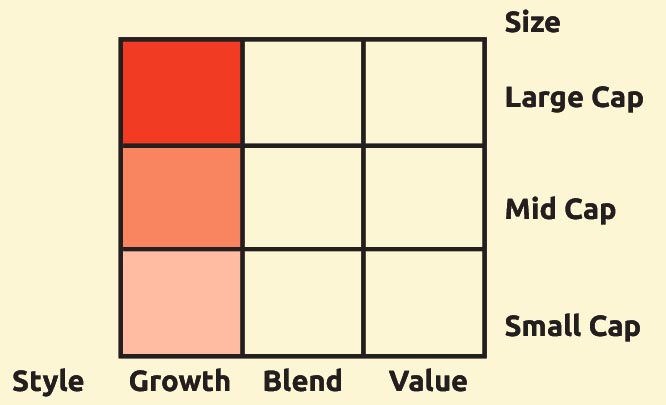
• Fund has a "Growth" and "Quality" oriented investment style with emphasis on visibility of earnings and healthy return ratios
Category: Large Cap
 : ₹ 1,029.99 Crores
AUM or assets under management refers to the recent / updated cumulative market value of investments managed by a mutual fund or any investment firm.
: ₹ 1,040.79 Crores
AUM or assets under management refers to the recent / updated cumulative market value of investments managed by a mutual fund or any investment firm.
:
An employee of the asset management company such as a mutual fund or life insurer, who manages investments of the scheme. He is usually part of a larger team of fund managers and research analysts.
Other Parameter:
| Beta
Beta is a measure of an investment's volatility vis-a-vis the market. Beta of less than 1 means that the security will be less volatile than the market. A beta of greater than 1 implies that the security's price will be more volatile than the market. | 0.86 |
| R Square | 0.93 |
| Standard Deviation (Annualized)
Standard deviation is a statistical measure of the range of an investment's performance. When a mutual fund has a high standard deviation, its means its range of performance is wide, implying greater volatility. | 14.86% |
| Sharpe*
The Sharpe Ratio, named after its founder, the Nobel Laureate William Sharpe, is a measure of risk-adjusted returns. It is calculated using standard deviation and excess return to determine reward per unit of risk. | 1.02 |
| Portfolio Turnover Ratio | |
| Equity | 0.78 |
| Aggregate^ | 0.78 |
| Total Expense Ratio | |
| Regular | 2.17% |
| Direct | 0.95% |
(w.e.f. April 18, 2017)
SIP (Minimum Amount): ₹ 100/- (Minimum 6 instalments)
SIP Frequency: Monthly/Quarterly (w.e.f. 09-11-2022)
SIP Dates (Monthly/Quarterly)@@:
Investor may choose any day of the month except 29th, 30th and 31st as the date of installment.
Investment Objective: Click here
Minimum Investment Amount : ₹ 1,000/- and any amount thereafter
Option Available: Growth, IDCW$ (Payout, Reinvestment and Sweep (from Equity Schemes to Debt Schemes only))
:
Exit load is charged at the time an investor redeems the units of a mutual fund. The exit load is deducted from the prevailing NAV at the time of redemption. For instance, if the NAV is ₹ 100 and the exit load is 1%, the redemption price would be ₹ 99 per unit.
from the date of allotment:
►Up to 10% of investment: Nil,
►For remaining investment: 1% of applicable NAV
•If redeemed / switched out after 365 days from date
of allotment: Nil. (w.e.f. June 25, 2021)
NAV (₹) as on March 31, 2023
| Regular Plan | Growth | 47.79 |
| Regular Plan | IDCW$ | 17.22 |
@@If SIP day falls on a non-business day, the SIP transaction shall be processed on the next business day.
| Name | % of NAV | |
| Equity and Equity related Instruments | 99.67% | |
| Banks | 28.05% | |
| oHDFC Bank | 9.88% | |
| oICICI Bank | 7.90% | |
| oAxis Bank | 3.80% | |
| IndusInd Bank | 2.68% | |
| State Bank of India | 2.05% | |
| Kotak Mahindra Bank | 1.75% | |
| IT - Software | 13.42% | |
| oInfosys | 5.64% | |
| oTata Consultancy Services | 2.99% | |
| LTIMindtree | 2.24% | |
| HCL Technologies | 1.49% | |
| Tech Mahindra | 1.05% | |
| Petroleum Products | 9.32% | |
| oReliance Industries | 9.32% | |
| Diversified FMCG | 6.73% | |
| oITC | 4.13% | |
| Hindustan Unilever | 2.60% | |
| Finance | 6.17% | |
| oHDFC | 3.73% | |
| Cholamandalam Invt and Fin Co | 1.53% | |
| Bajaj Finance | 0.91% | |
| Chemicals & Petrochemicals | 5.23% | |
| oAnupam Rasayan India | 3.05% | |
| Rossari Biotech | 2.17% | |
| Automobiles | 4.81% | |
| Maruti Suzuki India | 1.44% | |
| Mahindra & Mahindra | 1.38% | |
| TVS Motor Company | 1.00% | |
| Tata Motors | 0.99% | |
| Consumer Durables | 2.97% | |
| Titan Company | 1.58% | |
| Asian Paints | 1.39% | |
| Construction | 2.85% | |
| oLarsen & Toubro | 2.85% | |
| Electrical Equipment | 2.74% | |
| ABB India | 1.65% |
| Name | % of NAV | |
| Siemens | 1.09% | |
| Cement & Cement Products | 2.52% | |
| UltraTech Cement | 2.52% | |
| Pharmaceuticals & Biotechnology | 2.38% | |
| Sun Pharmaceutical Industries | 1.20% | |
| Dr. Reddy's Laboratories | 0.64% | |
| Cipla | 0.54% | |
| Telecom - Services | 2.00% | |
| Bharti Airtel | 2.00% | |
| Transport Services | 1.58% | |
| InterGlobe Aviation | 1.58% | |
| Power | 1.56% | |
| NTPC | 1.09% | |
| Tata Power Company | 0.46% | |
| Industrial Products | 1.52% | |
| Cummins India | 1.04% | |
| Bharat Forge | 0.48% | |
| IT - Services | 1.18% | |
| L&T Technology Services | 1.18% | |
| Non - Ferrous Metals | 1.07% | |
| Hindalco Industries | 1.07% | |
| Ferrous Metals | 1.05% | |
| Tata Steel | 1.05% | |
| Food Products | 0.98% | |
| Britannia Industries | 0.98% | |
| Retailing | 0.53% | |
| Trent | 0.53% | |
| Personal Products | 0.52% | |
| Godrej Consumer Products | 0.52% | |
| Auto Components | 0.49% | |
| Samvardhana Motherson International | 0.49% | |
| Corporate Bond | 0.004% | |
| Britannia Industries | AAA | 0.004% |
| Net Cash and Cash Equivalent | 0.33% | |
| Grand Total | 100.00% | |
oTop 10 Equity Holdings |
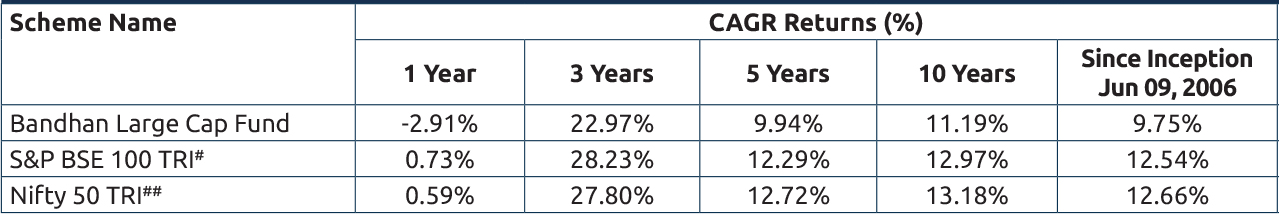
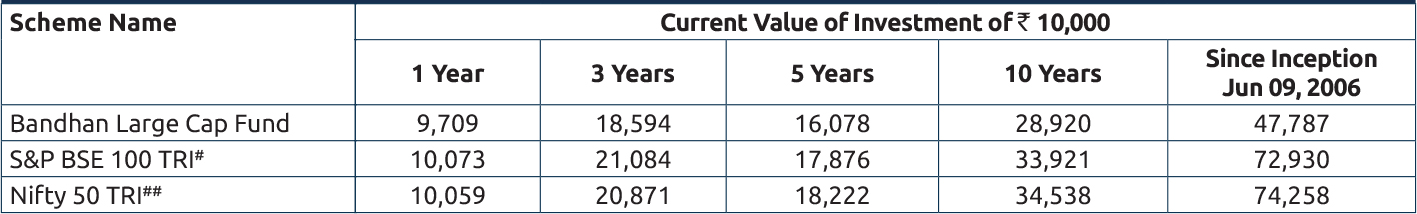
Performance based on NAV as on 31/03/2023. Past performance may or may not be sustained in future.
performances given are of regular plan growth option.
Click here for other funds managed by the fund manager and refer to the respective fund pages
#Benchmark Returns. ##Alternate Benchmark Returns.
Scheme risk-o-meter
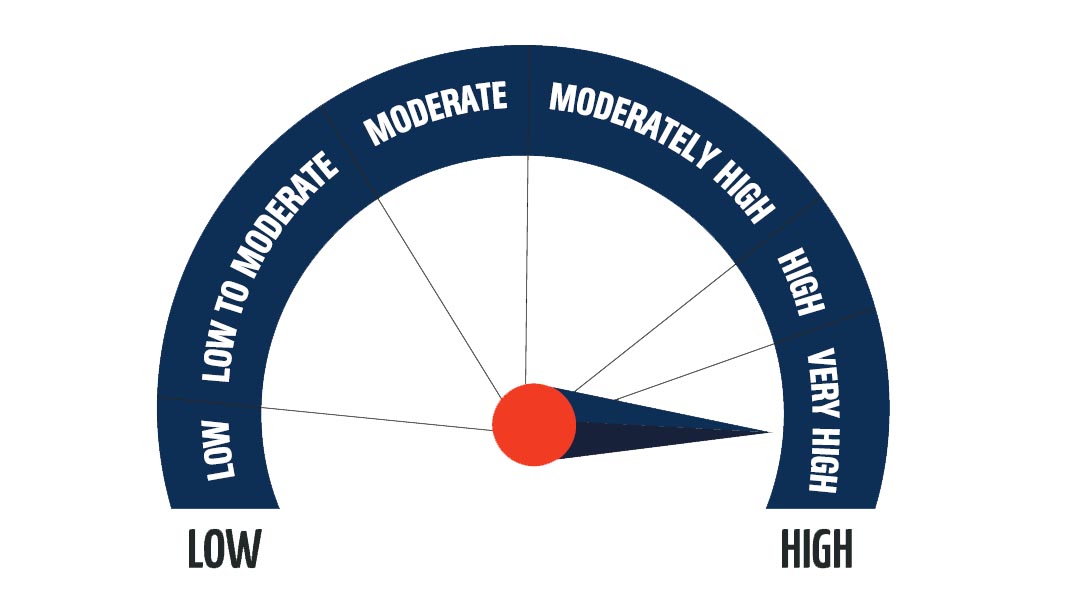
Investors understand that their principal will be at Very High risk
This product is suitable for investors who are seeking*
- To create wealth over long term.
- Investment predominantly in equity and equity related instruments of the large cap companies.
* Investors should consult their financial advisers if in doubt about whether the product is suitable for them.
Benchmark risk-o-meter
S&P BSE 100 TRI
Regular and Direct Plans have different expense structure. Direct Plan shall have a lower expense ratio excluding distribution expenses, commission expenses etc.
*Risk-free rate assumed to be 7.79% (FBIL OVERNIGHT MIBOR as on 31st March 2023). Ratios calculated on the basis of 3 years history of monthly data.
^Portfolio Turnover ratio is calculated as Lower of purchase or sale during the period / Average AUM for the last one year (includes Fixed Income securities and Equity derivatives).
Current Index performance adjusted for the period from since inception to April 18, 2017 with the performance of Nifty 50 TRI (Benchmark)
Current Index performance adjusted for the period from since inception to June 28, 2007 with the performance of S&P BSE 100 price return index (Benchmark)
The fund has been repositioned from an IPO fund to a large cap fund w.e.f. April 18, 2017
§With effect from 13th March 2023, the name of "IDFC Large Cap Fund" has changed to "Bandhan Large Cap Fund"
