Commentary

Commentary
|
|
|
|
|

|


Global Markets
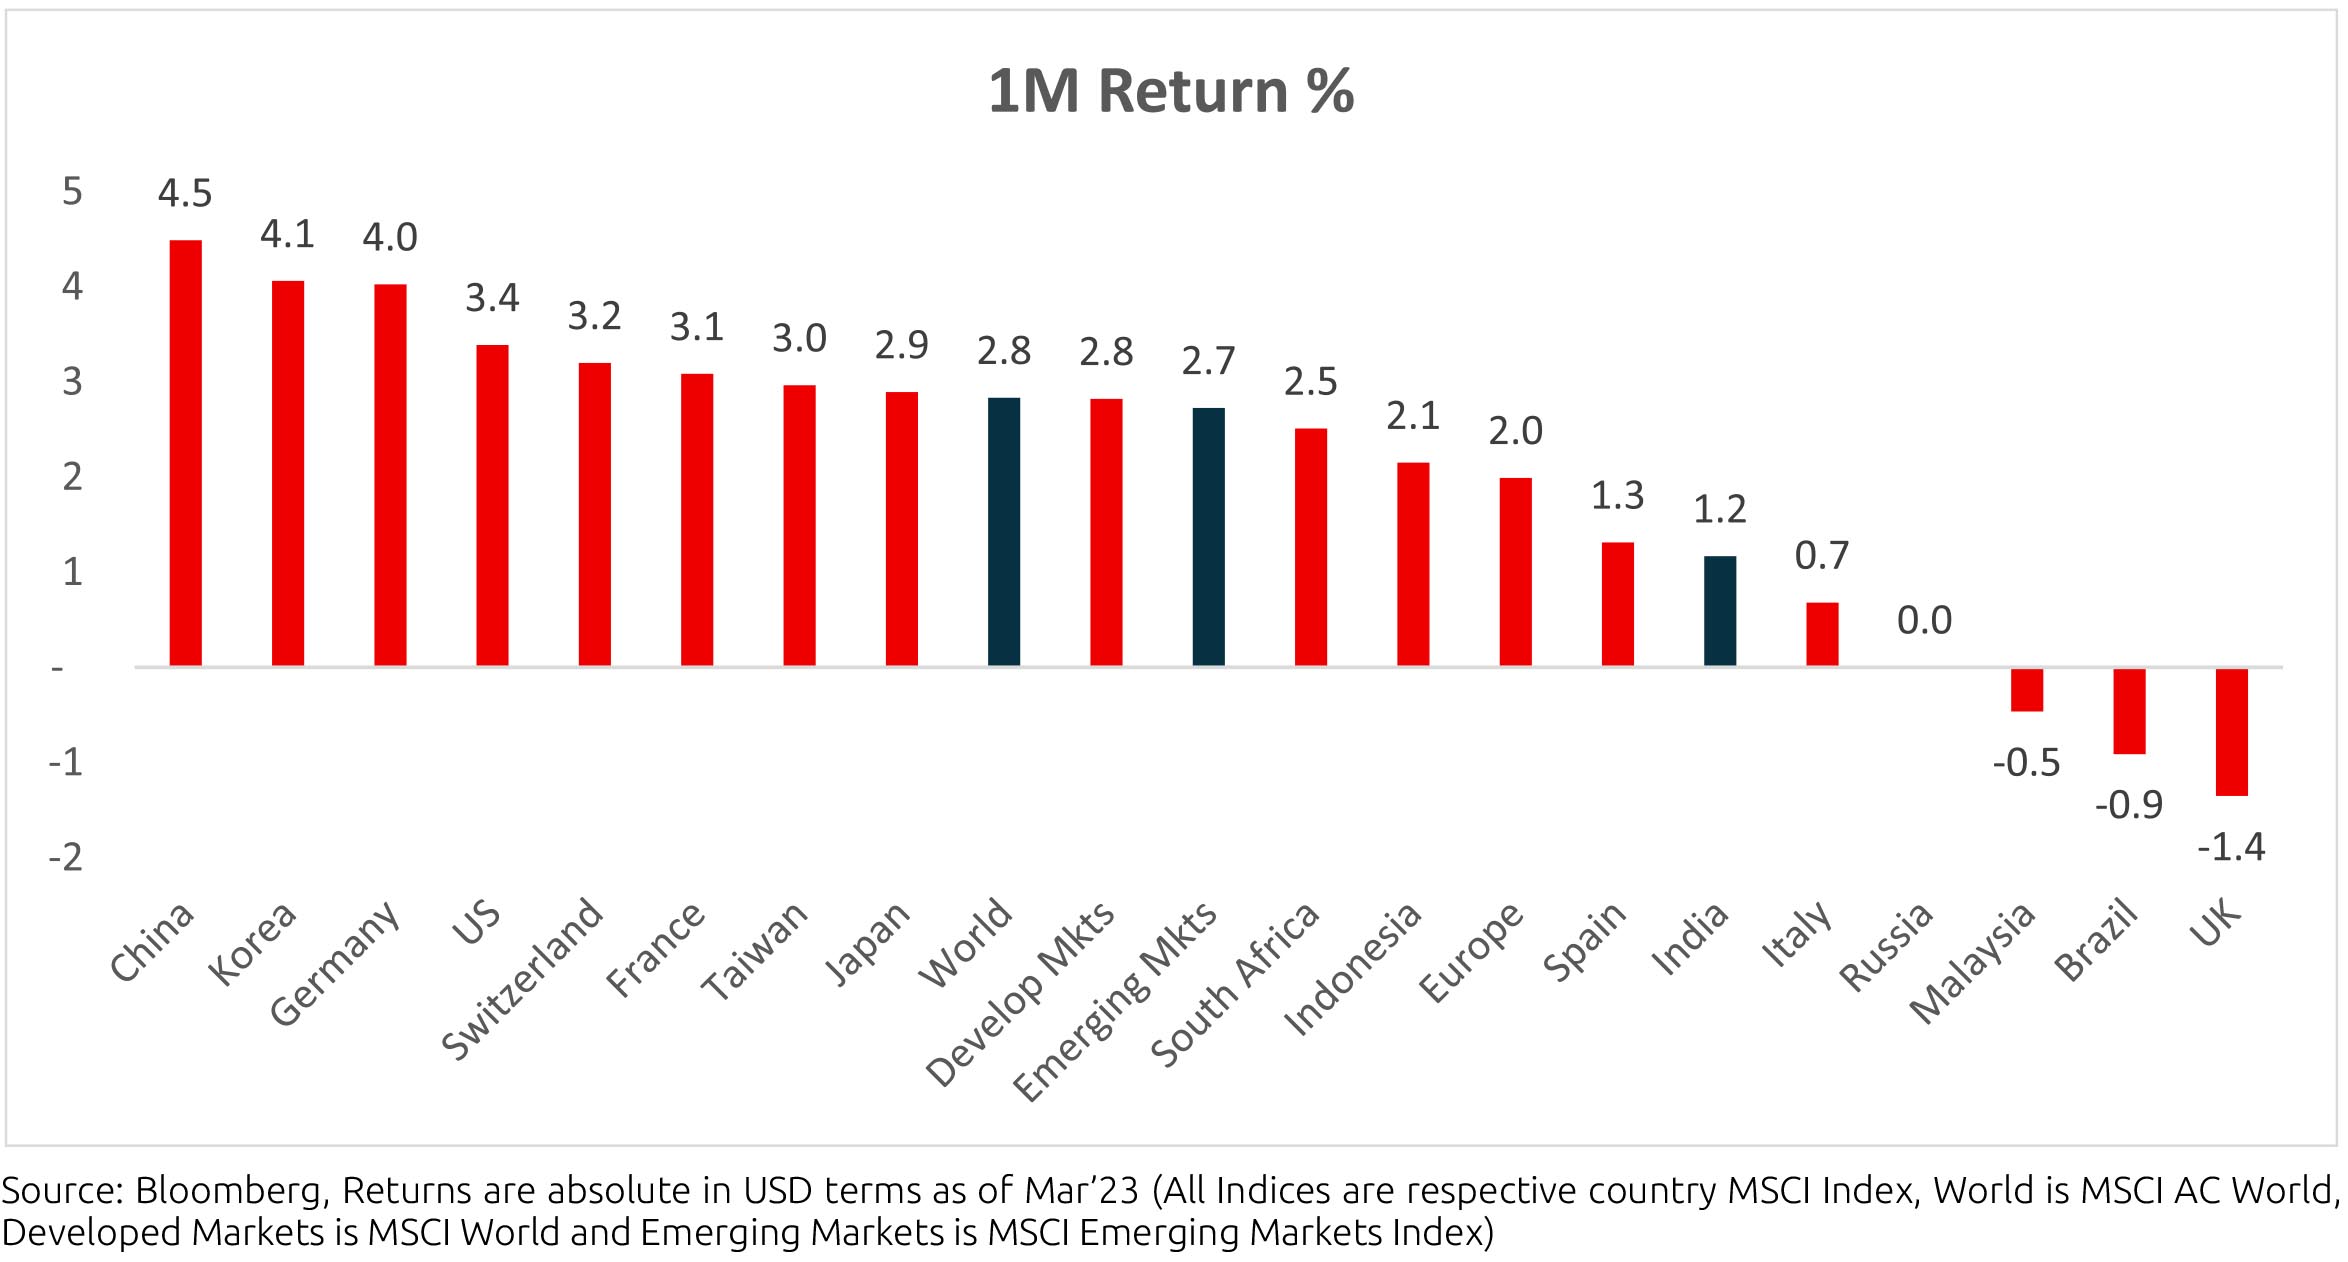
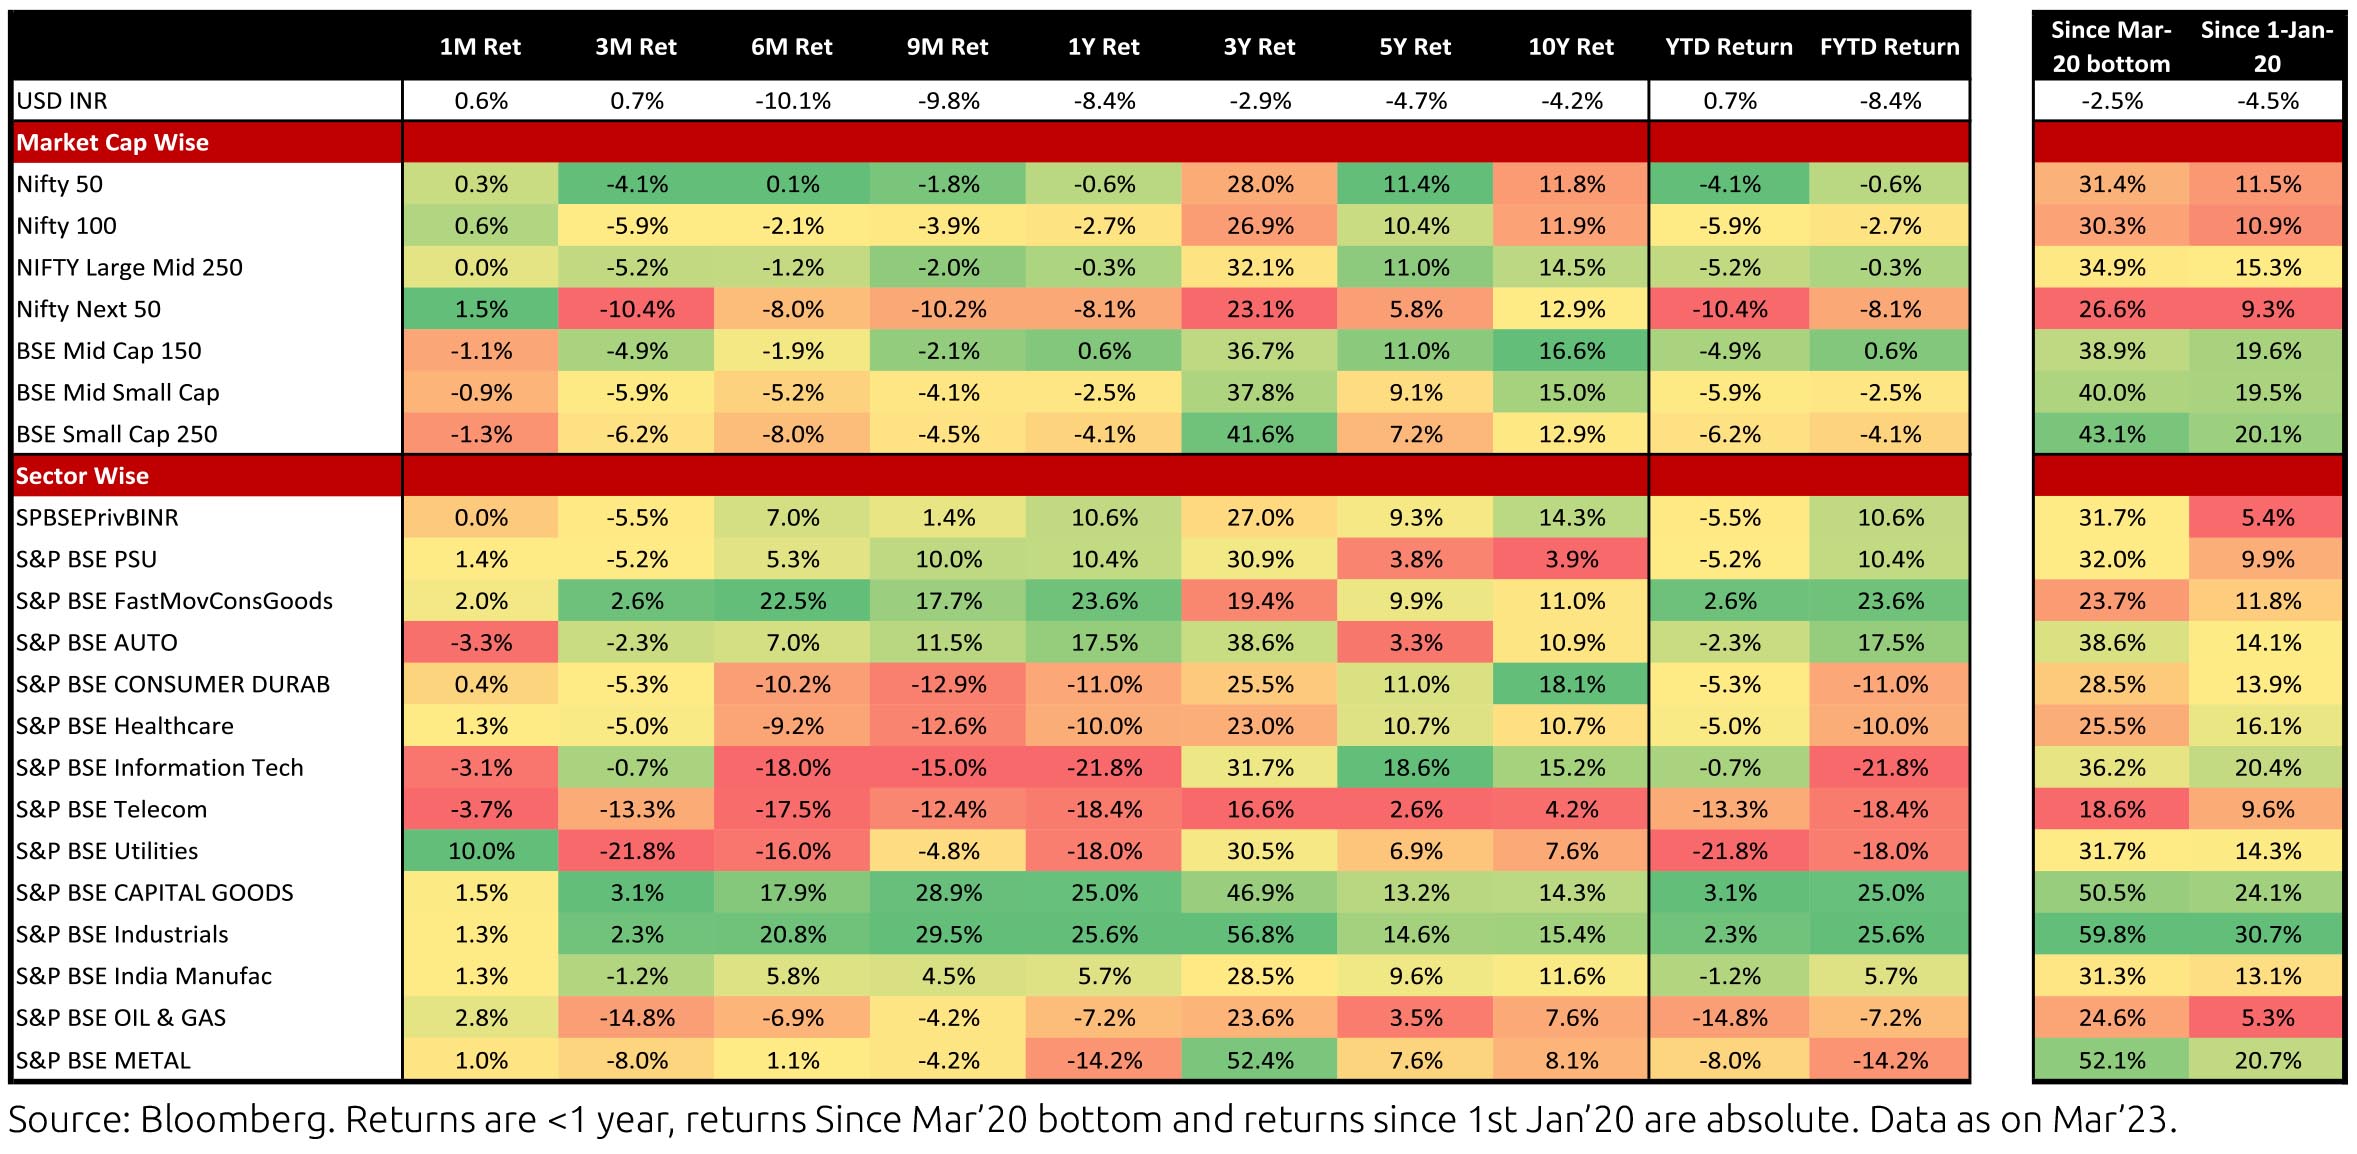
Global equities delivered strong returns across regions in March (MSCI World +2.8% MoM), barring UK, Brazil and
Malaysia. MSCI China was the strongest performer (+4.5% MoM) with the US (+3.4% MoM) also delivering strong
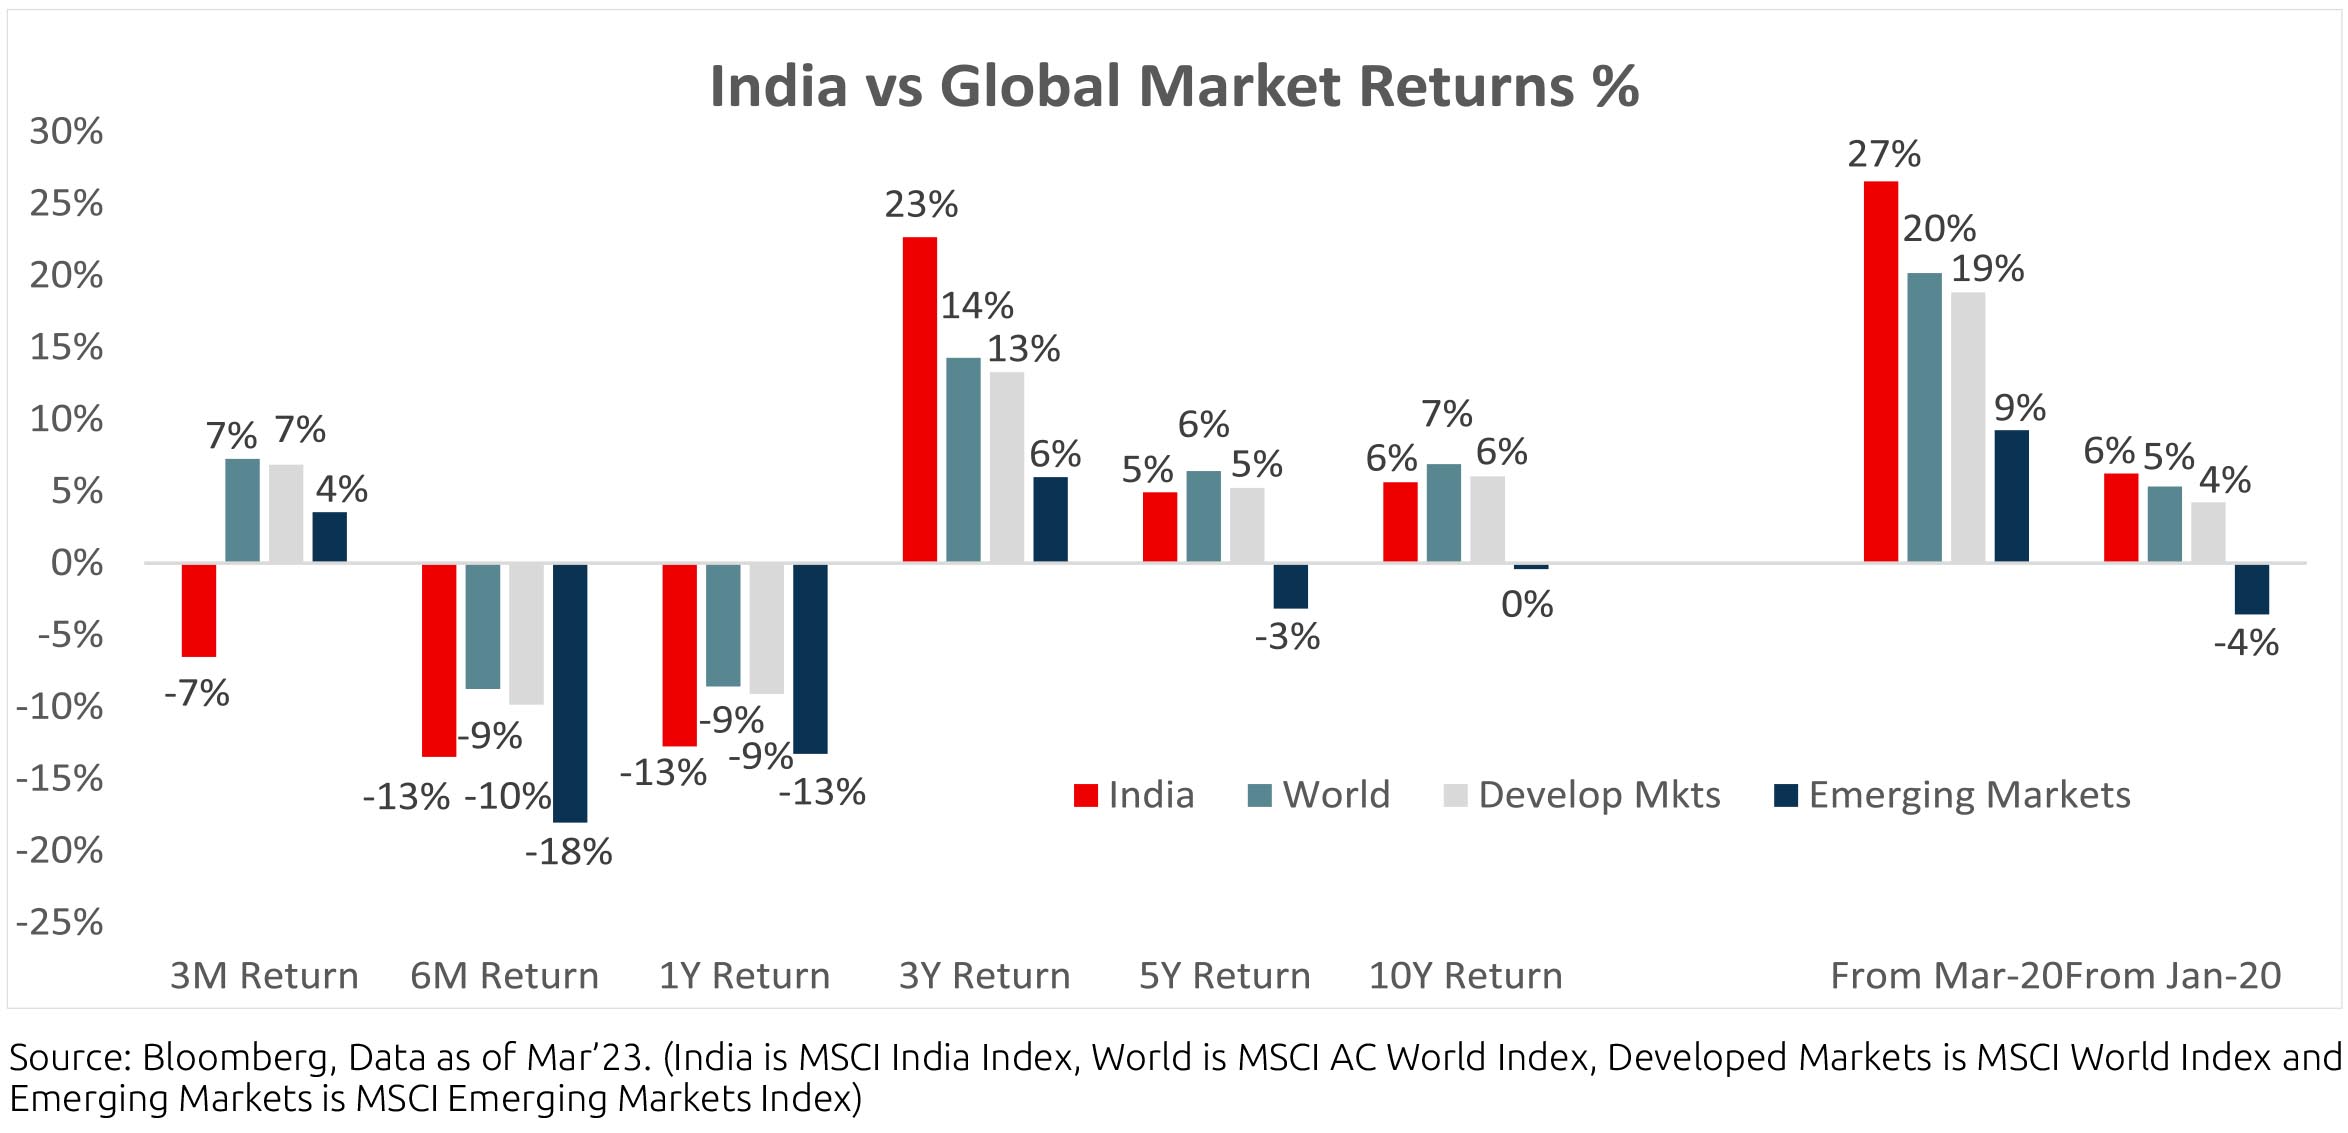
returns. Indian equities gained (+1.2% MoM/-12.7% FYTD), while underperforming the region and peers (MSCI APxJ/
EM: +2.5%/+2.7% MoM).
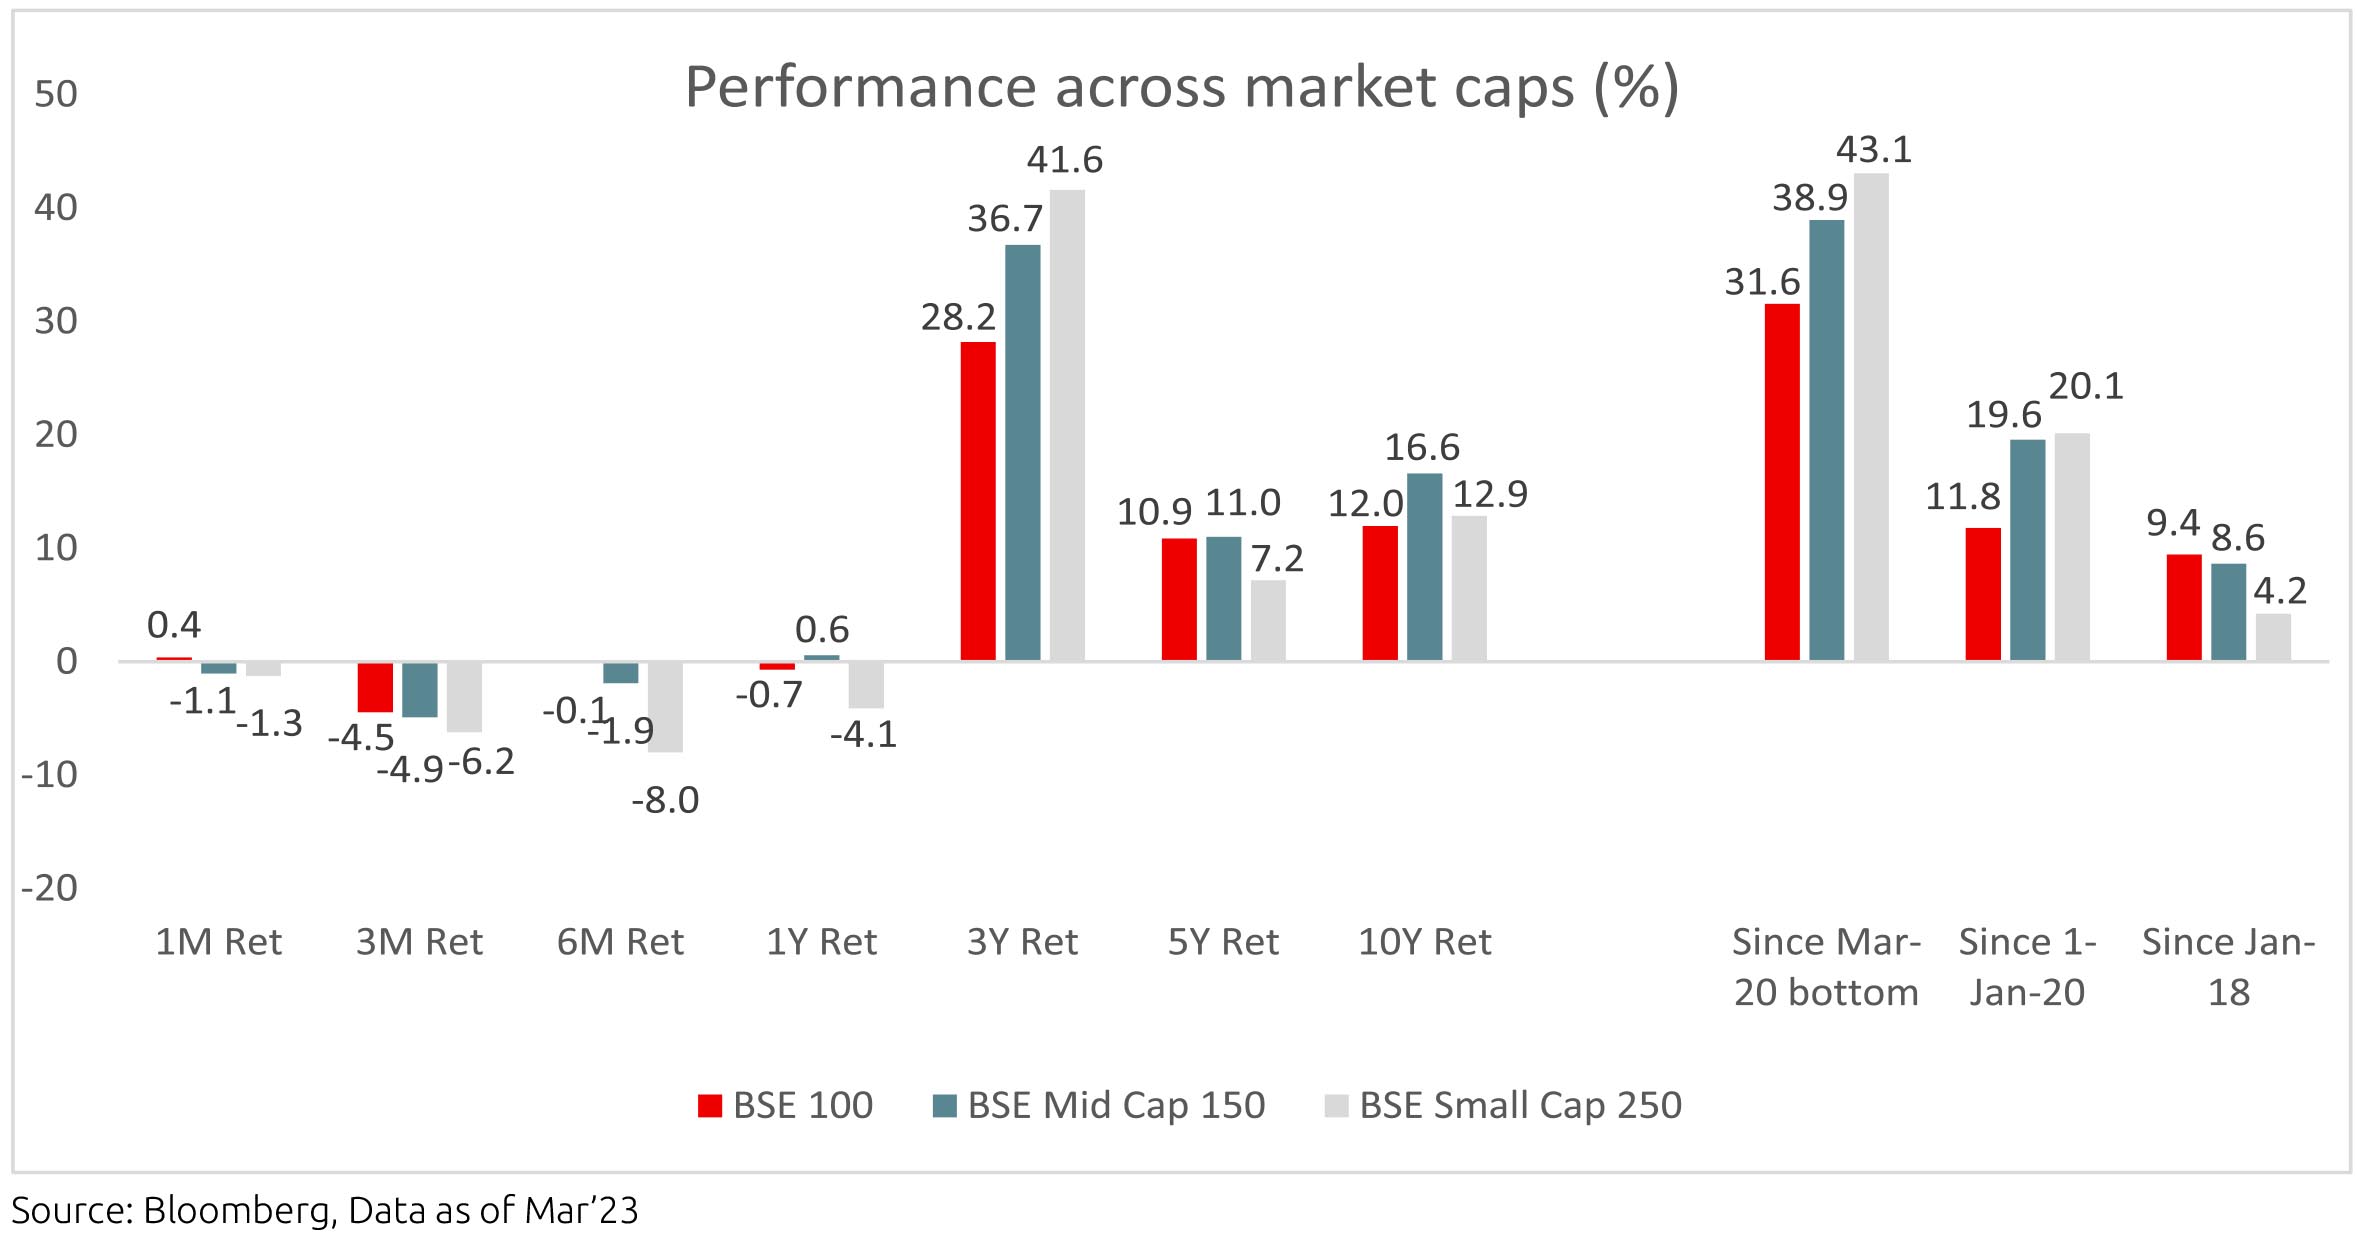
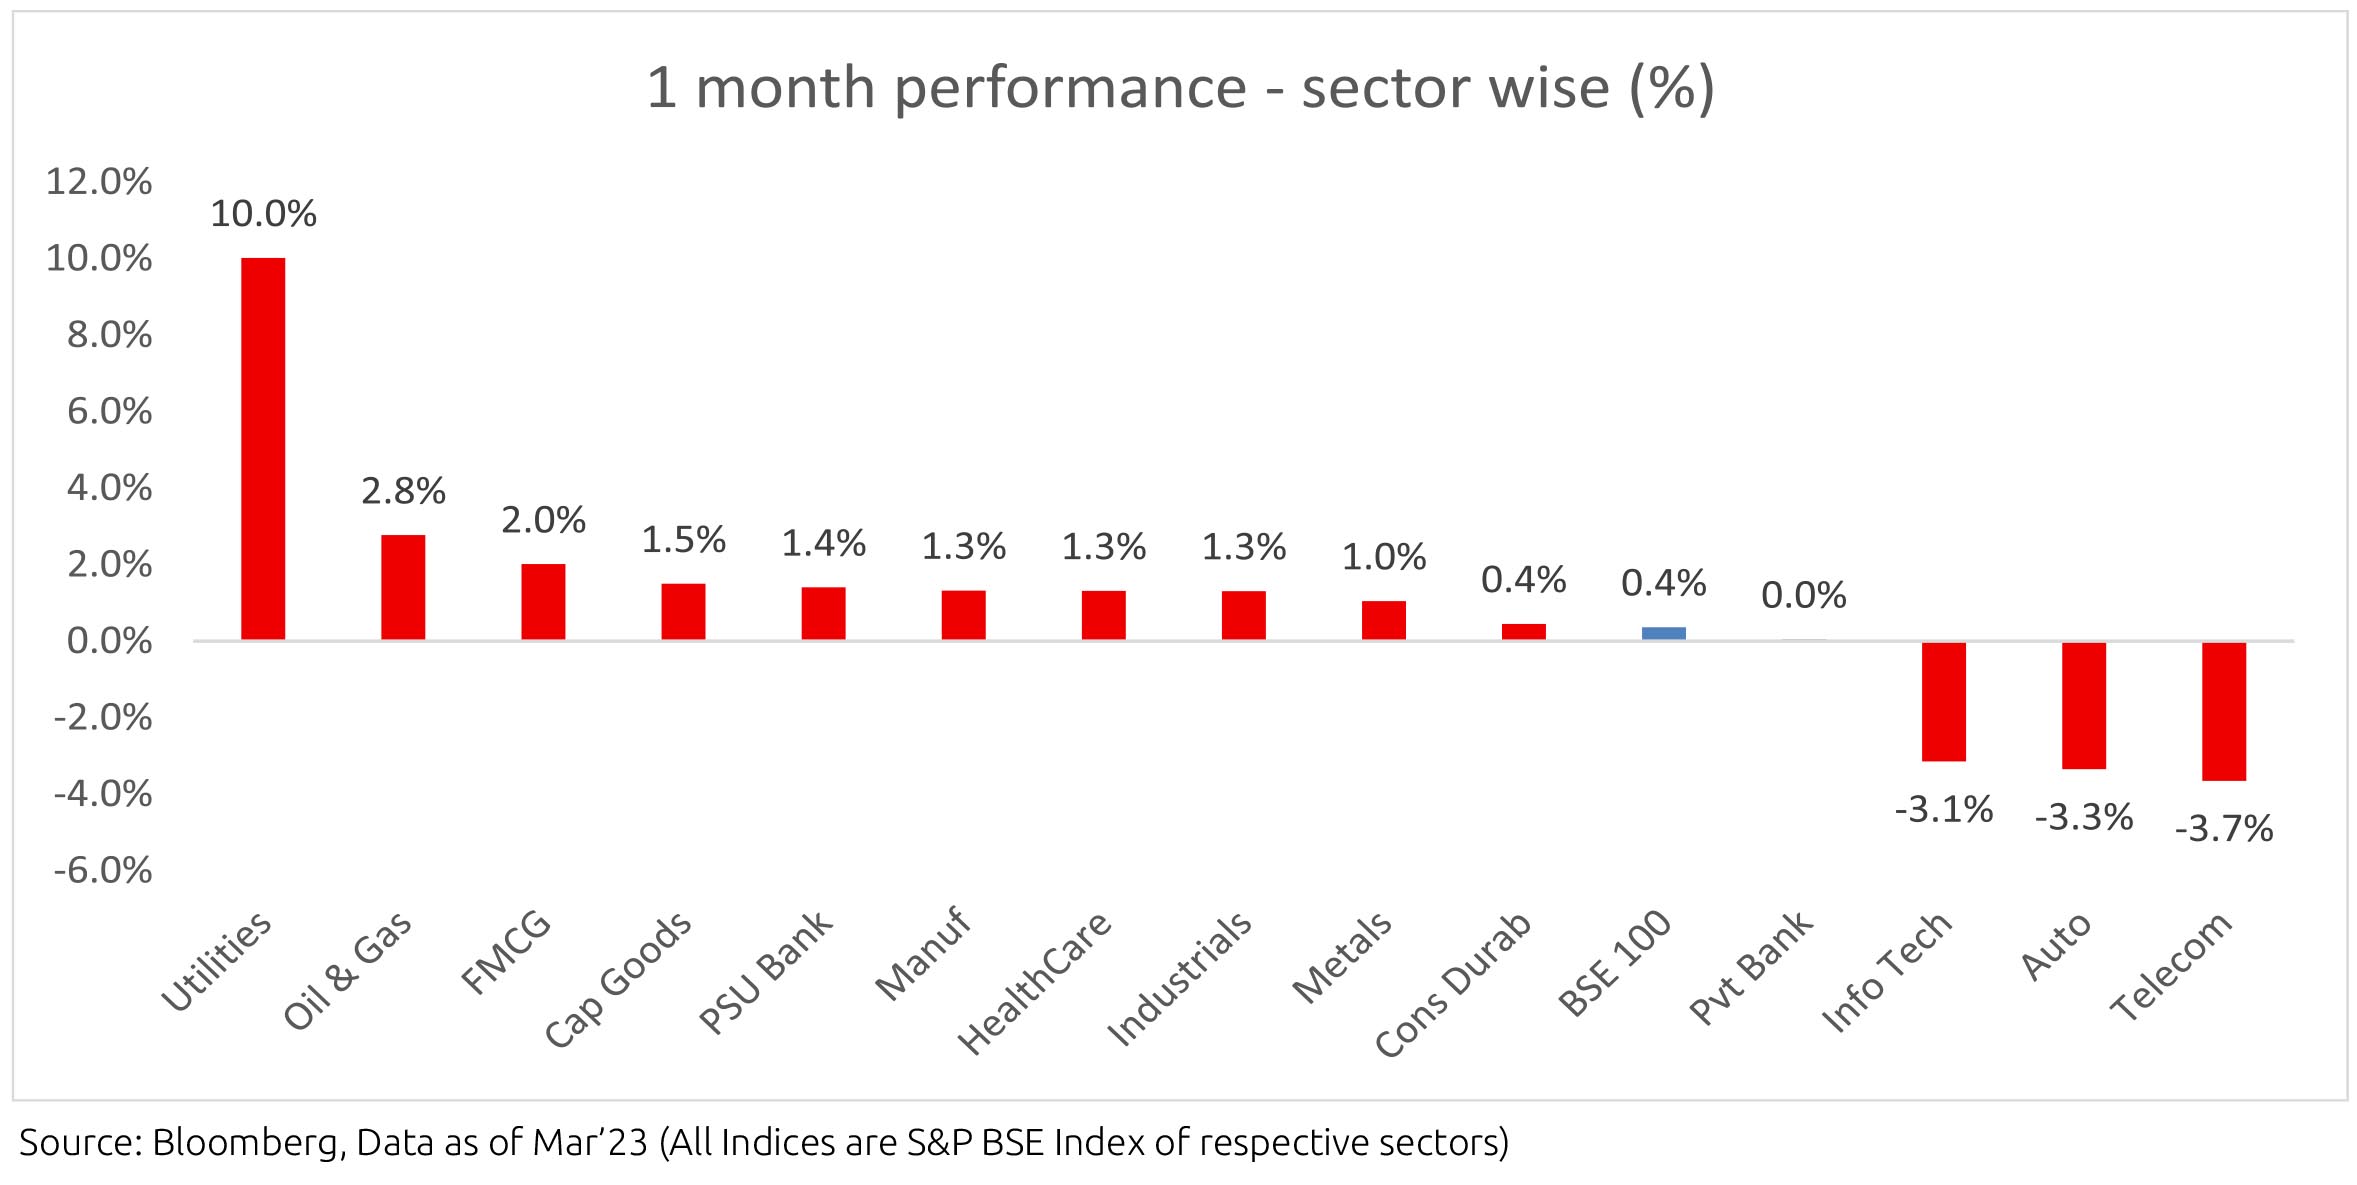
MSCI India (in local currency) gained 0.4% MoM. Most sectors except IT, Auto and telecom ended the month in
the green, as the NIFTY rose (+0.3% MoM), closing the month near 17,400 levels. Utilities was the strongest
sector, followed by Oil & Gas and Staples (FMCG). Mid-caps (-1.1% MoM) and small caps (-1.3% MoM) declined and
underperformed the large caps (+0.4%).
Macro Economics:
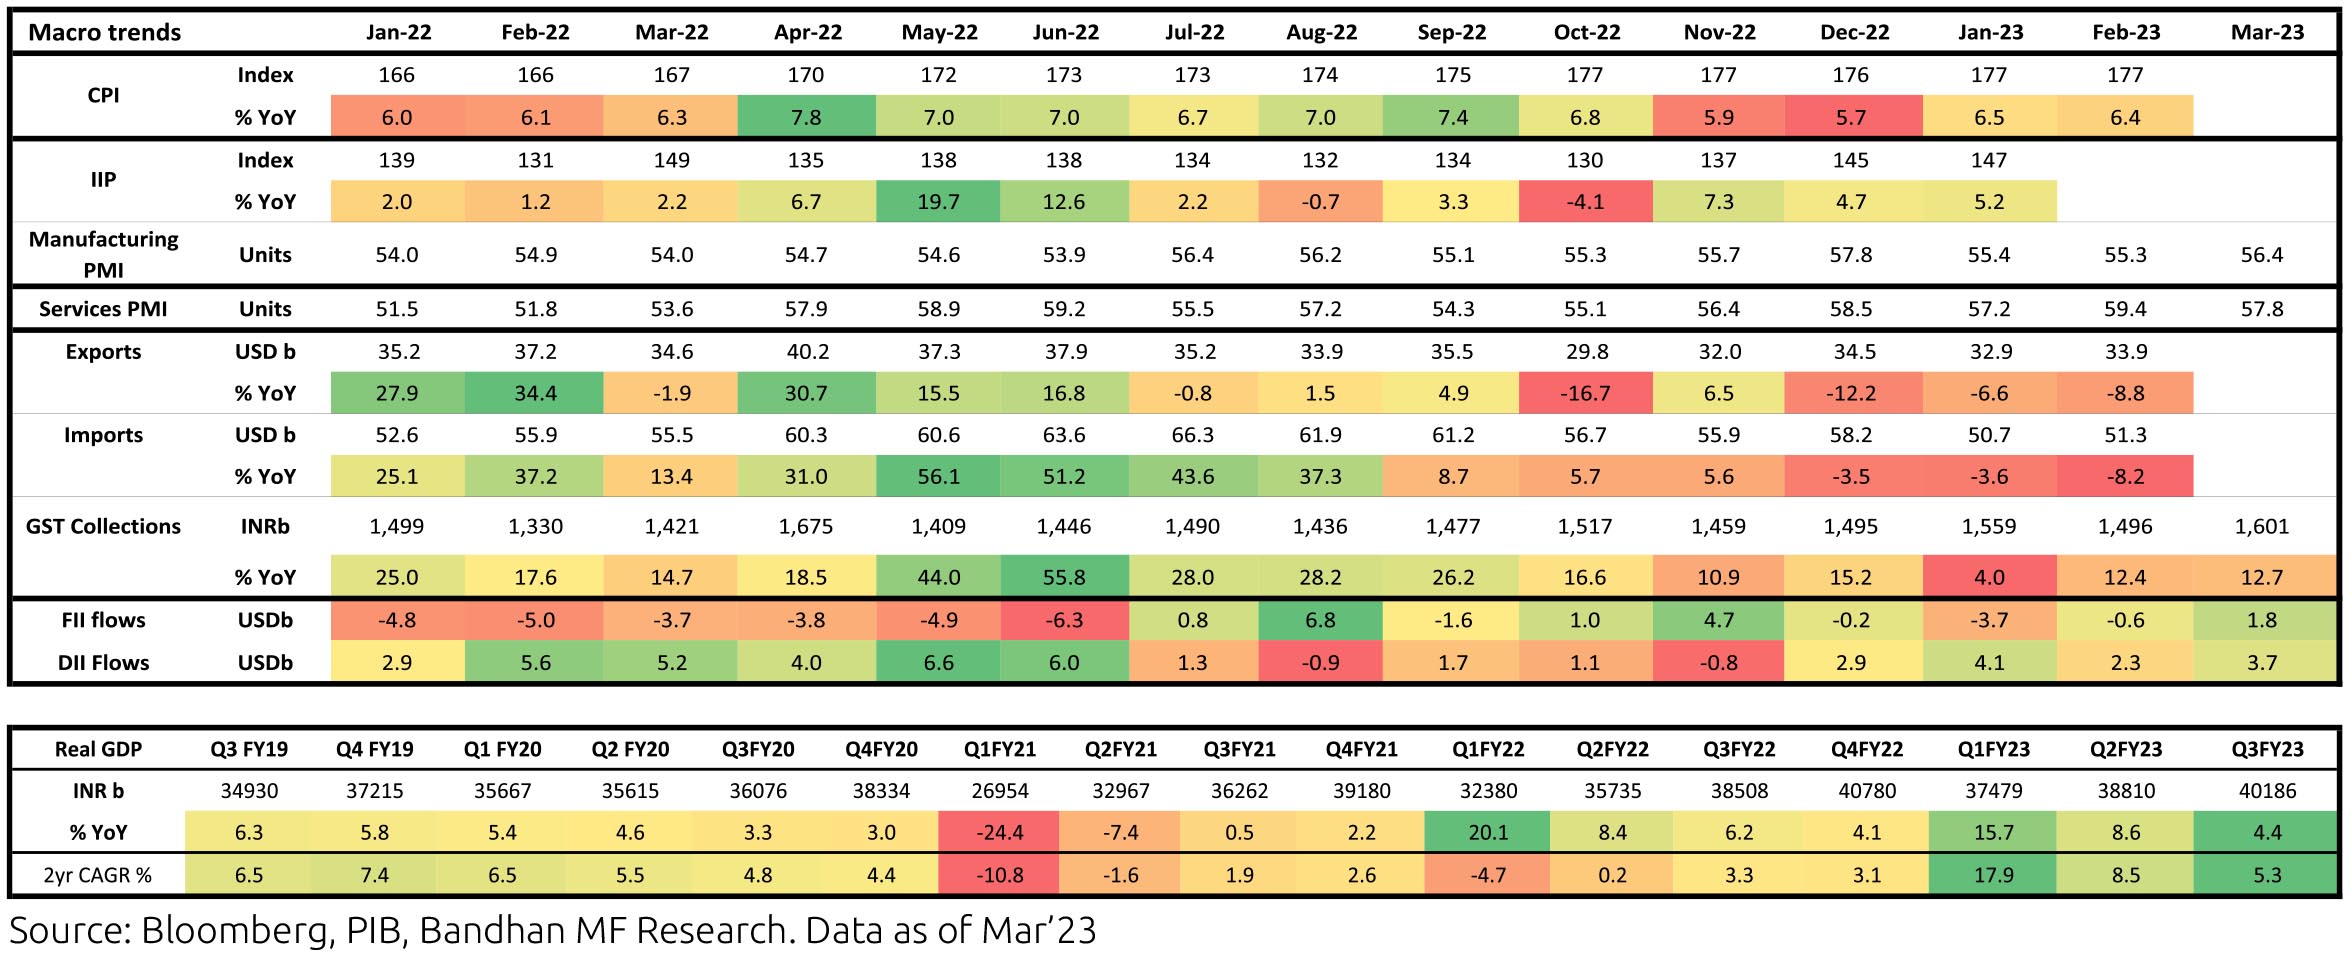
• February CPI remained elevated at 6.4% while February WPI eased to 3.9% YoY.
• January's industrial production improved marginally (+5.2% YoY); Within sectors, capital goods and infra goods posted strong sequential gains. This is likely underpinned by strong government capex spending.
• India's FX reserves came in at $579bn. FX reserves have risen by US$17.8bn in the last four weeks.
• India's trade deficit has improved dramatically in 3QFY23 led by lower net merchandise imports (commodity prices, seasonality), and a very strong Indian Services exports.
• Fiscal Deficit April-Feb 2023 at 82.8% of RE. Gross tax revenue in 11M FY23 was at 83.7% of FY2023RE (growth of 12%), whereas net tax revenue was at 83% of FY2023RE (growth of 17%).
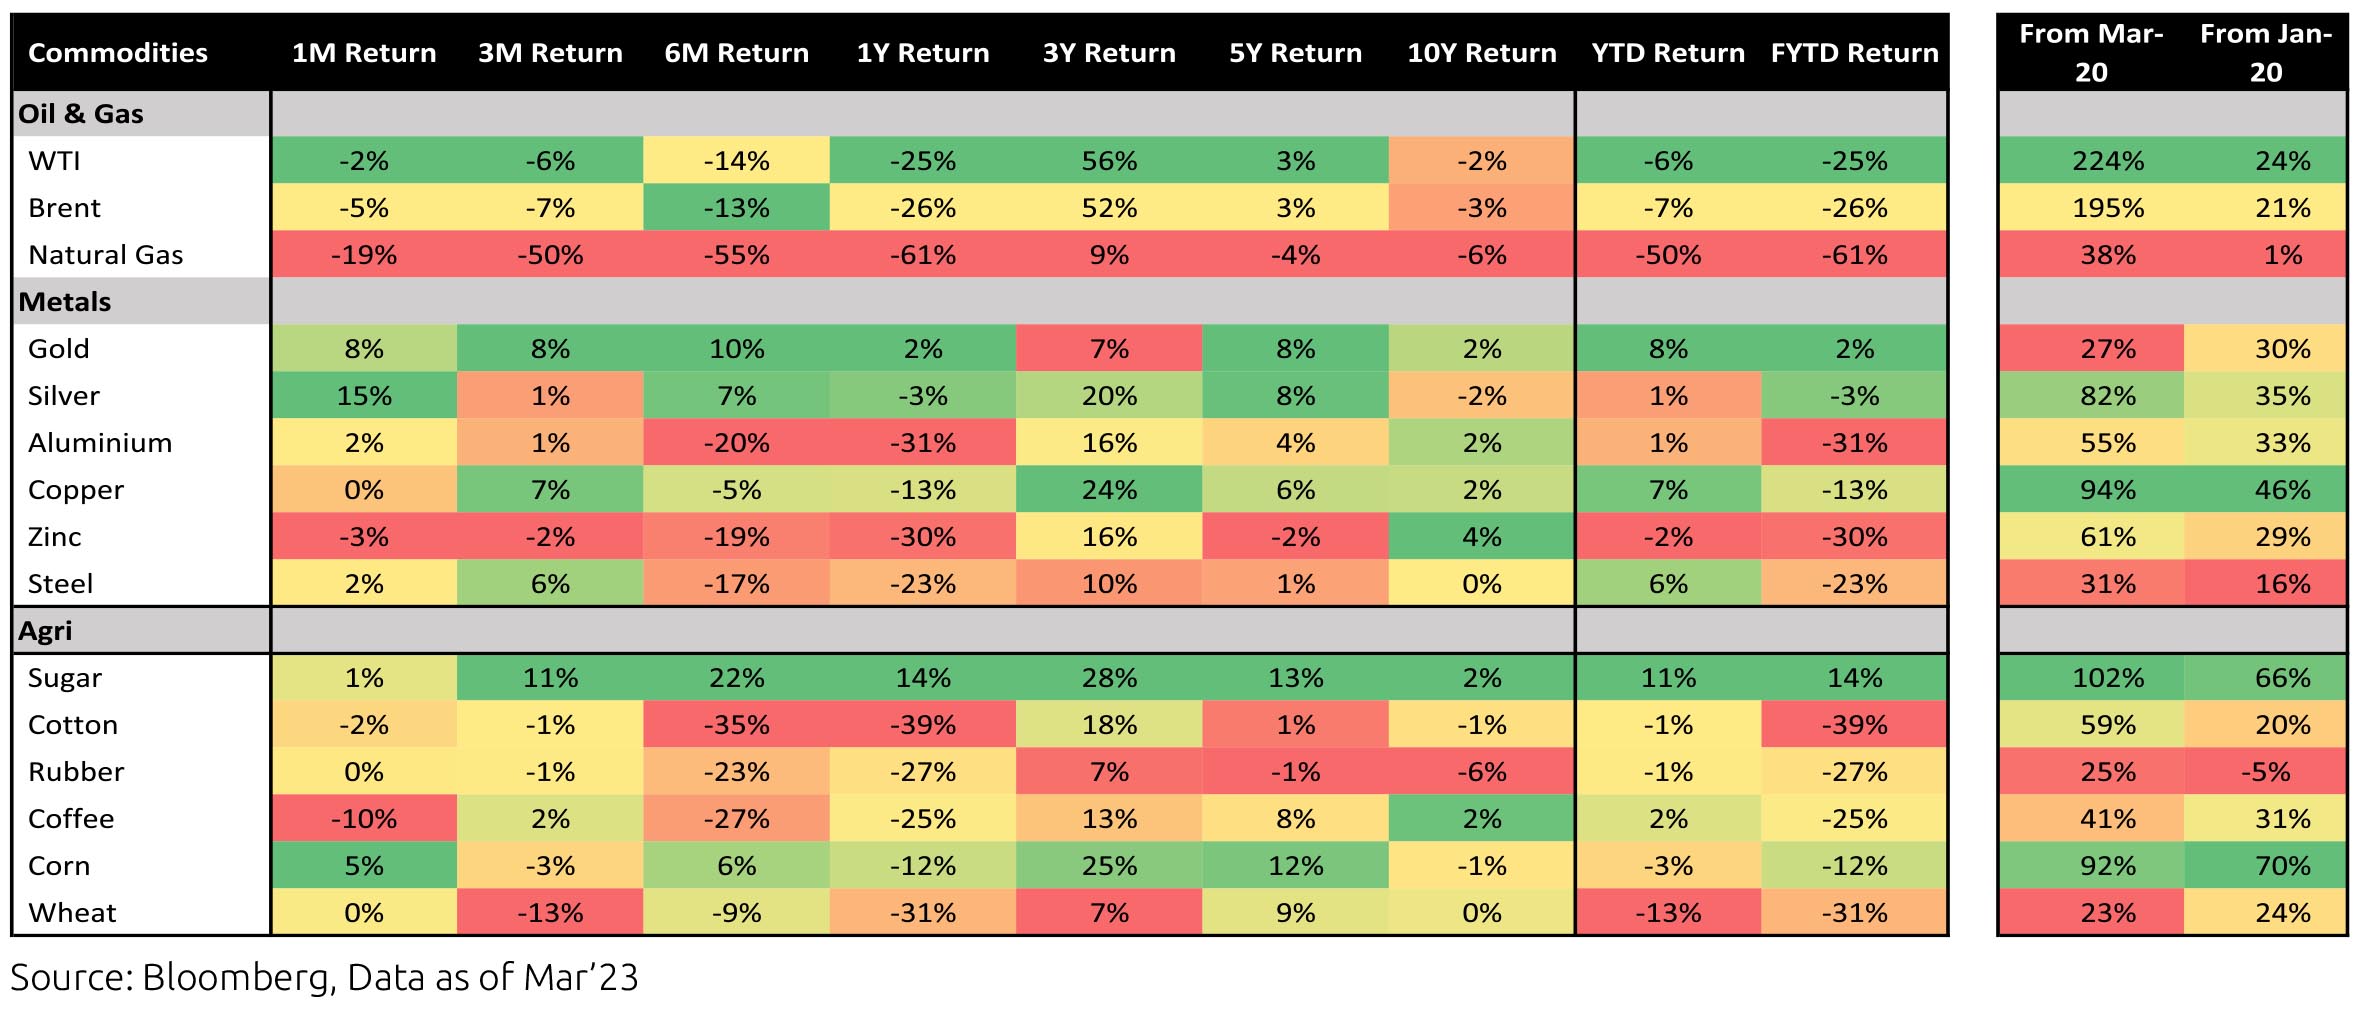
• The INR appreciated by 0.6% MoM, reaching ~82.18/USD in March. The DXY weakened by 2.3% over the month. Oil prices declined (-4.9%) in March.
• FIIs reversed their selling momentum in March (+$1.8bn, following -$0.6bn in February). India has seen FII outflows of -$5.97bn FYTD. DIIs saw buying of $3.7bn in March, keeping on trend with the previous months
• March GST collections continues to be above Rs 1.4trn for the 14th straight month and stood at Rs 1.6trn.
Domestic Markets
Macro Economics:
• February CPI remained elevated at 6.4% while February WPI eased to 3.9% YoY.
• January's industrial production improved marginally (+5.2% YoY); Within sectors, capital goods and infra goods posted strong sequential gains. This is likely underpinned by strong government capex spending.
• India's FX reserves came in at $579bn. FX reserves have risen by US$17.8bn in the last four weeks.
• India's trade deficit has improved dramatically in 3QFY23 led by lower net merchandise imports (commodity prices, seasonality), and a very strong Indian Services exports.
• Fiscal Deficit April-Feb 2023 at 82.8% of RE. Gross tax revenue in 11M FY23 was at 83.7% of FY2023RE (growth of 12%), whereas net tax revenue was at 83% of FY2023RE (growth of 17%).
• The INR appreciated by 0.6% MoM, reaching ~82.18/USD in March. The DXY weakened by 2.3% over the month. Oil prices declined (-4.9%) in March.
• FIIs reversed their selling momentum in March (+$1.8bn, following -$0.6bn in February). India has seen FII outflows of -$5.97bn FYTD. DIIs saw buying of $3.7bn in March, keeping on trend with the previous months
• March GST collections continues to be above Rs 1.4trn for the 14th straight month and stood at Rs 1.6trn.
Market Performance
Outlook
Continuing the trend, even the first 3 months of the equity markets have been volatile led by growing global uncertainties. Near term risk of volatility continuous to remains high, however there are some big positives emerging: first - global interest rates are beginning to trend down especially at the long end (the US 10yr yield is almost 100bps lower from peak in October), Second - India's current account has improved materially with oil price coming down and services exports growing handsomely, and Third - the US dollar is weakening which improves global liquidity.
History has proved that equity markets have been rewarding those who stay the course in a lull like current times. While last few quarters have not generated great returns, we recommend investors to stay disciplined in asset allocation using tools like SIP.
Note: The above graph is for representation purposes only and should not be used for the development or implementation of an investment strategy. Past performance may or may not be sustained in the future.
Consumer Price Index (CPI) inflation in India was in line with expectation at 6.4% y/y in February, after an upside surprise at
6.5% in January, as momentum in food and beverage prices contracted mildly. While price momentum in cereals, milk and fruits
stayed positive, it fell for vegetables, oils & fats, meat & fish, pulses, etc. Core inflation (CPI excluding food and beverages, fuel
and light) stayed high and sticky at 6.1% and has averaged the same from April 2022, after 6% in FY22. Real time prices of wheat,
certain vegetable oils and vegetables continue to ease sequentially. The impact of recent untimely rains in wheat growing states
on the magnitude and timing of harvest, procured from mid-March, is to be seen. The Government has also reportedly relaxed
norms for wheat procurement in some states to ensure healthy procurement and avoid potential distress sales by farmers.
On FYTD fiscal data during April-February of FY23, central government net tax revenue growth was 17% y/y while total expenditure grew 11%. Fiscal deficit so far is thus 82.8% of FY23 revised estimate vs. 83.1% this time last year. Small savings inflow during April-February of FY23 was lower than that during the same period of last year and needs to be ~Rs. 86,000cr higher during March (vs. last year). GST collection was buoyant at Rs. 1.6 lakh crore and 12.7% y/y during March.
Industrial production (IP) growth was 5.2% y/y in January after 4.7% in December. On a seasonally adjusted month-on-month basis, this was +2% in January after -0.6% in December. Output momentum eased for primary and consumer non-durable goods but it turned positive for all other categories. Infrastructure Industries output (40% weight in IP) fell 1.9% m/m (seasonally adjusted) in February after +2.4% in January.
Bank credit outstanding as on 24th March was up 15% y/y, moderating from late October 2022, and has averaged 14.8% since April 2022 (after 8% during January-March of 2022). Bank deposit growth is at 9.6% as on 24th March. Credit flow till date during the financial year has been much higher, than in the previous two financial years, with strong flows to personal loans (40% of total flow) and services (32% of total flow).
Merchandise trade deficit for February fell further to USD 17.4bn from USD 17.7bn in January and USD 22.1bn in December. In February, oil exports were flat and non-oil exports were up USD 1bn. Oil imports were marginally up but non-oil-non-gold imports moderated further after falling strongly in January. Trade deficit had picked up from September 2021 (average of USD 21.6bn since September 2021 vs. USD 10.8bn during April-August 2021 when non-oil-non-gold imports picked up to an average of USD 38.1bn vs. USD 29.3bn). However, it is now well off the recent high of USD 29.3bn in September 2022. Services trade surplus has continued to surprise to the upside in recent months.
India's Current Account Deficit (CAD) for the December 2022 quarter was lower than expectations and the September quarter number was also revised down. This was 2.2% of GDP in the December quarter after 3.8% in the September quarter, during which overall BoP balance also turned positive to USD 11.1bn from USD -30.4bn. For April-December, India's CAD was 2.7% of GDP.
Central Government G-sec borrowing calendar for H1 FY24 pegged gross borrowing at Rs. 8.88tn (58% of full year Budget Estimate) and thus net borrowing at Rs. 7.52tn (64% of full year BE). This implies gross borrowing of Rs. 6.55tn and net borrowing of Rs. 4.29tn in H2 FY24. G-sec borrowing maturity-bucket-shares for H1 FY24 were similar to H1 FY23 but higher in 30-40y and lower in 5y. T-bill borrowing during Q1 FY24 has been pegged at Rs. 4.16 lakh crore (vs. Rs. 4.31 lakh crore in Q1 FY23) and percentage shares of 91-d, 182-d and 364-d borrowings are similar to Q1 FY23. States' market borrowing (State Development Loan - SDL) calendar suggests Rs. 2tn gross borrowing in Q1 FY24 (vs. Q1 FY23 calendar of Rs. 1.9tn and actual borrowing of Rs. 1.1tn). States' actual SDL borrowing has been undershooting calendar amounts in FY22 and FY23. However, borrowing in recent SDL auctions were higher than calendar. For e.g., states borrowed Rs. 38,000cr and Rs. 31,000cr lower than the respective calendar amounts in January and February but they borrowed Rs. 29,000cr more in March.
Among higher-frequency variables, number of two-wheelers registered picked up sharply from October (likely also festive season effect) but eased strongly thereafter. This has improved only mildly during January-March. Energy consumption levels, after staying above previous year levels, has fallen below from mid-March. Monthly number of GST e-way bills generated picked up to 9.1cr units in March after 8.2cr each in January and February. It thus averaged 8.5cr in the March quarter after 8.1cr in the December quarter and 7.9cr in the September quarter.
US headline CPI was at 6% y/y in February after 6.4% in January, driven by negative momentum in prices of energy goods and goods-ex-food-fuel. Momentum in services continued to stay strong as rents and non-housing-core-services moved higher. Core CPI was at 5.5% in February after 5.6% in January. US non-farm payroll addition in March (236,000 persons) was broadly in line with expectation after February (326,000 persons). Unemployment rate moderated to 3.5% and Labour Force Participation Rate inched up further. Sequential growth in average hourly earnings was at 0.3% in March after 0.2% in February. Non-farm job openings as per the Job Openings and Labor Turnover Survey (JOLTS) fell by 0.6mn in February after falling by 0.7mn in January.
In response to the banking sector issues in the US, the Fed responded by introducing a new Bank Term Funding Program, apart from its standing discount window. This was to provide liquidity to banks and other eligible depository institutions to help meet the demand for its deposits. Also, as backstop, the US Treasury provided 25bn dollars towards this facility, in case there are losses. Further, the Fed along with the Treasury and the Federal Deposit Insurance Corporation (FDIC) made a joint statement that the FDIC has been enabled to complete the resolution of the Silicon Valley Bank such that all depositors have full access to their money and no losses are borne by the taxpayer. They also announced a similar exception for another bank and announced a review of SVB's (Silicon Valley Bank) supervision and regulation. The FOMC (Federal Open Market Committee) raised the target range for the federal funds rate by 25 bps on 22nd March, a total of 475bps since 2022 to the 4.75-5.00% range. However, the statement was changed to suggest 'some additional policy forming may be appropriate' vs. 'ongoing increases' previously. The median fed funds rate projected for 2023, as per the Summary of Economic Projections, was also unchanged. The Fed Governor in his interaction after the FOMC meeting said the recent events in the banking sector are expected to tighten credit conditions and this would work in the same direction as rate tightening. However, he also said it is too soon to determine the effects and thus monetary policy response.
The European Central Bank's Governing Council in its monetary policy decision in March raised all the three key interest rates by 50bps, as communicated in its February meeting and by a total of 350bps so far in this cycle. It said the elevated level of uncertainty reinforces the importance of a data-dependent approach to policy rate decisions, which will be determined by their assessment of the inflation outlook in light of the incoming economic and financial data (latter mainly credit related and thus financial conditions), the dynamics of underlying inflation and the strength of monetary policy transmission.
Against majority expectation, MPC paused on rate hikes in a unanimous decision. All except Prof. Varma chose to persist with 'withdrawal of accommodation', with the latter presumably wanting to shift to neutral in light of his view that repo rate should have peaked earlier. While choosing not to hike in April policy, the Governor (on behalf of MPC majority) has also made it a point to underscore that this may not necessarily be the end of the cycle. He notes the improvement in our external situation (current account deficit compressing and forex reserves built back to higher than USD 600 billion), the prospects of inflation falling ahead (RBI forecast for FY 24 10 bps lower at 5.2%), and drag from the external sector on growth (though GDP forecast for FY 24 is a shade higher now). Nevertheless, core inflation is sticky, there has been a recent upside surprise from food inflation, and risks to this persist from climatic conditions.
All told the MPC majority may have been inclined to deliver a last 'insurance' hike had global conditions remained as they were till a few weeks back. However, the recent issues with US regional banks and a large European one, and the consequent actual and expected tightening in credit conditions, have changed the mix materially. We have covered this in detail in a recent note (https://bandhanmutual.com/article/12018). The upshot is that this has significantly altered market's expectation of Fed fund's trajectory basis the expected impact on growth from the said credit tightening. There's an element of financial stability consideration as well that may be creeping back into global monetary policy decision making even as the backdrop remains one of uncomfortably high inflation. This has led to central banks letting off on incremental tightening somewhat, even as the propensity is for the foot to still be hovering in the vicinity of the brake.
RBI / MPC's own trade-offs are more moderate. India's growth, though slowing, is not likely to fall off a cliff. Inflation, though uncomfortable today, is within shouting distance of the comfort zone. However, global considerations for the last incremental hike seem legitimate and MPC has rightly considered these in its decision making. Also, the cumulative effective hikes of 290 bps are still feeding into the system. The pause (not pivot, as the Governor has specified) firmly keeps the anchor of inflation in mind. With stance remaining 'withdrawal of accommodation' it seems the bias with the majority members is still to consider another hike.
Outlook
We think the rate cycle has peaked in India. It is likely that we are now in a period of long pause, unless there are near term further upward surprises to inflation. To elaborate upon this qualifier, we are reasonably confident that no further hikes are needed if one were to look at the likely evolution of growth-inflation dynamics over the next 6 - 12 months. Tighter credit conditions in the west will lead to weaker than earlier anticipated growth. This will continue to feed into India's growth dynamics as well, alongside the cumulative impact of tightening done so far that is yet to be fully felt. With India having avoided any extraordinarily large fiscal stimulus over the Covid response period, it isn't apparent why cyclical demand should stay as strong as it is currently (structural tailwinds are well documented including from balance sheet cleanups in India). For these reasons, we expect growth to be substantially shy of RBI's current forecast for FY 24. If there are further upside manifestations to inflation in the immediate future, before the factors mentioned here have played out, then the last rate hike may very well come back on the table. However, this will eventually be splitting hair for medium term bond investors. As mentioned multiple times before, we think investors should be overweight quality bonds in both a fixed income as well as a multi asset allocation context.
The recent fly in the ointment, so to speak, is that post tax returns on traditional fixed income allocations via mutual funds have fallen for allocations starting the new fiscal year. This has already started conversations on adding risk in asset allocation tables including from credit, liquidity, and from other asset classes. This is partly understandable given that post tax yield on quality fixed income is going to be noticeably lower than before. However, there are two points of caution: One, the reach for 'return / yields' during such periods fundamentally implies a framework where appetite for risk is variable but return expectation is static. Whereas the decision to take more risk should consider natural underlying risk appetite as well as a view on the macro-economic backdrop and whether this supports the incremental expansion of risk appetite. While the former is a matter of individual assessment, our view on the macro-economic evolution over the next few quarters isn't consistent with adding on more risk (outside of interest rate risk). As an example spreads on lower rated credits, generally speaking, are reasonably tight to start with and may not be adequately reflecting both the tightening liquidity conditions as well as deteriorating macro-economic outlook.
In summary then the investment logic remains strong for overweight quality fixed income (3 to 6 year maturities as per our view). While investors may be balancing this with recent tax changes, there is need to be mindful of how much expansion of risk appetite is being undertaken especially in light of the evolving macro- economic and liquidity situation. One also has to be reminded that tax on debt mutual funds is at worst at parity with most other fixed income options and not inferior to them. The other elements of liquidity, diversification, etc very much remain with the mutual fund. Also, if we are right on our economic growth view, it is likely that credit growth slows over the year ahead and the yield curve steepens. This will also allow the value in moderate duration (3 - 5 years maturing) high quality debt mutual fund products to get revealed again versus very front end options that are currently absorbing a lot of investor monies.
