Bandhan Core Equity Fund§
Large & Mid Cap Fund - An open ended equity scheme investing in both large cap and mid cap stocks

Bandhan Core Equity Fund§
Large & Mid Cap Fund - An open ended equity scheme investing in both large cap and mid cap stocks
|
|
|
|
|

|


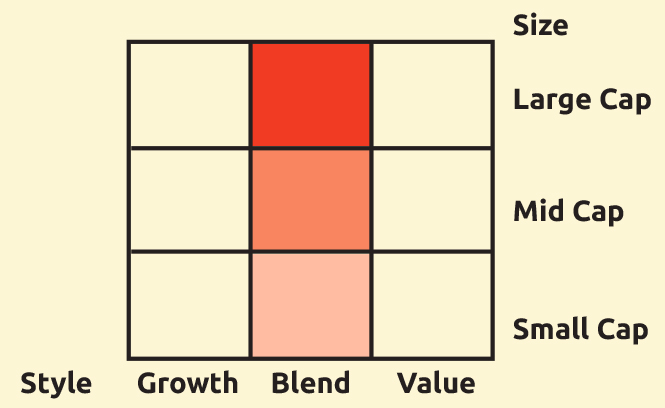
About the Fund: Bandhan Core Equity Fund is a diversified equity fund with a large and mid cap bias currently. The focus of the fund is to build a portfolio of Quality companies while being cognizant of the relative valuation.
Category: Large & Mid Cap
 : ₹ 2,733.85 Crores
AUM or assets under management refers to the recent / updated cumulative market value of investments managed by a mutual fund or any investment firm.
: ₹ 2,802.06 Crores
AUM or assets under management refers to the recent / updated cumulative market value of investments managed by a mutual fund or any investment firm.
:
An employee of the asset management company such as a mutual fund or life insurer, who manages investments of the scheme. He is usually part of a larger team of fund managers and research analysts.
Ms. Nishita Shah (will be managing overseas investment portion of the scheme.)
Other Parameter:
| Beta
Beta is a measure of an investment's volatility vis-a-vis the market. Beta of less than 1 means that the security will be less volatile than the market. A beta of greater than 1 implies that the security's price will be more volatile than the market. | 0.89 |
| R Square | 0.92 |
| Standard Deviation (Annualized)
Standard deviation is a statistical measure of the range of an investment's performance. When a mutual fund has a high standard deviation, its means its range of performance is wide, implying greater volatility. | 13.72% |
| Sharpe*
The Sharpe Ratio, named after its founder, the Nobel Laureate William Sharpe, is a measure of risk-adjusted returns. It is calculated using standard deviation and excess return to determine reward per unit of risk. | 1.55 |
| Portfolio Turnover | |
| Equity | 1.10 |
| Aggregate^ | 1.11 |
| Total Expense Ratio | |
| Regular | 1.99% |
| Direct | 0.84% |
(w.e.f. 7th October 2019)
SIP (Minimum Amount): ₹ 100/- (Minimum 6 instalments)
SIP Frequency: Monthly/Quarterly (w.e.f. 09-11-2022)
SIP Dates (Monthly/Quarterly)@@: Investor may choose any day of the month except 29th, 30th and 31st as the date of instalment.
Investment Objective: Click here
Minimum Investment Amount : ₹ 1,000/- and any amount thereafter
Option Available: Growth, IDCW $ - (Payout, Reinvestment and Sweep (from Equity Schemes to Debt Schemes only))
:
Exit load is charged at the time an investor redeems the units of a mutual fund. The exit load is deducted from the prevailing NAV at the time of redemption. For instance, if the NAV is ₹ 100 and the exit load is 1%, the redemption price would be ₹ 99 per unit.
from the date of allotment:
► Upto 10% of investment:Nil,
► For remaining investment: 1% of applicable NAV.
• If redeemed / switched out after 365 days from date
of allotment: Nil. (w.e.f. May 08, 2020)
NAV (₹) as on July 31, 2023
| Regular Plan | Growth | 84.98 |
| Regular Plan | IDCW$ | 21.45 |
^^Mr. Anoop Bhaskar was managing this Scheme till 27th January 2023.
@@If SIP day falls on a non-business day, the SIP transaction shall be processed on the next business day.
| Name | % of NAV |
| Equity and Equity related Instruments | 96.61% |
| Banks | 21.08% |
| oHDFC Bank | 7.37% |
| oICICI Bank | 6.69% |
| oAxis Bank | 4.67% |
| AU Small Finance Bank | 0.99% |
| The Federal Bank | 0.73% |
| Indian Bank | 0.62% |
| Finance | 9.26% |
| oPower Finance Corporation | 2.71% |
| LIC Housing Finance | 1.37% |
| Piramal Enterprises | 1.03% |
| Cholamandalam Financial Holdings | 1.02% |
| M&M Financial Services | 0.85% |
| Mas Financial Services | 0.68% |
| REC | 0.58% |
| Poonawalla Fincorp | 0.56% |
| Reliance Strategic Investments | 0.48% |
| Auto Components | 7.49% |
| oUNO Minda | 1.81% |
| Bosch | 1.05% |
| Wheels India | 1.00% |
| Exide Industries | 0.89% |
| Apollo Tyres | 0.85% |
| Endurance Technologies | 0.84% |
| Sona BLW Precision Forgings | 0.51% |
| Tube Investments of India | 0.38% |
| Asahi India Glass | 0.15% |
| IT - Software | 7.47% |
| oInfosys | 4.07% |
| MphasiS | 1.64% |
| Tech Mahindra | 1.25% |
| Persistent Systems | 0.51% |
| Pharmaceuticals & Biotechnology | 6.60% |
| Laurus Labs | 1.01% |
| Aurobindo Pharma | 1.00% |
| Alkem Laboratories | 0.84% |
| Biocon | 0.76% |
| Lupin | 0.70% |
| IPCA Laboratories | 0.64% |
| Cipla | 0.59% |
| Gland Pharma | 0.56% |
| Ajanta Pharma | 0.51% |
| Petroleum Products | 4.39% |
| oReliance Industries | 4.39% |
| Electrical Equipment | 3.57% |
| Suzlon Energy | 0.88% |
| KEC International | 0.83% |
| Apar Industries | 0.67% |
| Siemens | 0.64% |
| Hitachi Energy India | 0.49% |
| GE T&D India | 0.06% |
| Industrial Products | 2.88% |
| Polycab India | 1.46% |
| APL Apollo Tubes | 0.74% |
| Cummins India | 0.68% |
| Power | 2.84% |
| oNTPC | 2.38% |
| NHPC | 0.46% |
| Name | % of NAV |
| Construction | 2.68% |
| oLarsen & Toubro | 2.68% |
| Diversified FMCG | 2.60% |
| oITC | 2.60% |
| Automobiles | 2.48% |
| TVS Motor Company | 1.45% |
| Tata Motors | 1.03% |
| Retailing | 2.06% |
| Aditya Birla Fashion and Retail | 1.55% |
| Zomato | 0.51% |
| Beverages | 2.02% |
| United Breweries | 1.10% |
| Varun Beverages | 0.92% |
| Realty | 1.76% |
| Prestige Estates Projects | 0.65% |
| Macrotech Developers | 0.47% |
| Mahindra Lifespace Developers | 0.32% |
| Kolte - Patil Developers | 0.31% |
| Consumer Durables | 1.42% |
| Metro Brands | 0.74% |
| Crompton Greaves Consumer Electricals | 0.68% |
| Ferrous Metals | 1.38% |
| Steel Authority of India | 1.38% |
| Insurance | 1.37% |
| Max Financial Services | 1.37% |
| Minerals & Mining | 1.34% |
| NMDC | 1.34% |
| Entertainment | 1.28% |
| Zee Entertainment Enterprises | 1.28% |
| Non - Ferrous Metals | 1.20% |
| Hindalco Industries | 1.20% |
| Telecom - Services | 1.15% |
| Bharti Airtel | 1.15% |
| Capital Markets | 1.13% |
| HDFC Asset Management Company | 0.63% |
| Angel One | 0.50% |
| Gas | 1.08% |
| Gujarat State Petronet | 1.08% |
| Aerospace & Defense | 1.07% |
| Bharat Electronics | 1.07% |
| Fertilizers & Agrochemicals | 1.07% |
| Coromandel International | 1.07% |
| Chemicals & Petrochemicals | 1.03% |
| Vishnu Chemicals | 0.57% |
| Navin Fluorine International | 0.46% |
| Healthcare Services | 1.02% |
| Apollo Hospitals Enterprise | 1.02% |
| Diversified | 0.71% |
| 3M India | 0.71% |
| Transport Services | 0.51% |
| InterGlobe Aviation | 0.51% |
| Leisure Services | 0.47% |
| Westlife Foodworld | 0.47% |
| Cement & Cement Products | 0.23% |
| JK Cement | 0.23% |
| Net Cash and Cash Equivalent | 3.39% |
| Grand Total | 100.00% |
oTop 10 Equity Holdings |
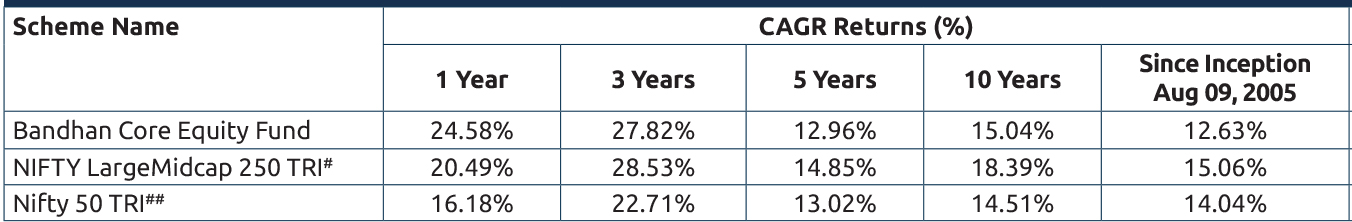
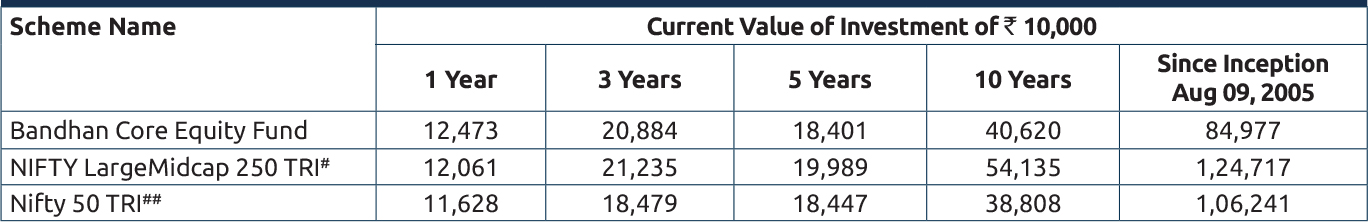
Performance based on NAV as on 31/07/2023. Past performance may or may not be sustained in future.
The performances given are of regular plan growth option.
Click here for other funds managed by the fund manager and refer to the respective fund pages
#Benchmark Returns. ##Alternate Benchmark Returns.
Scheme risk-o-meter
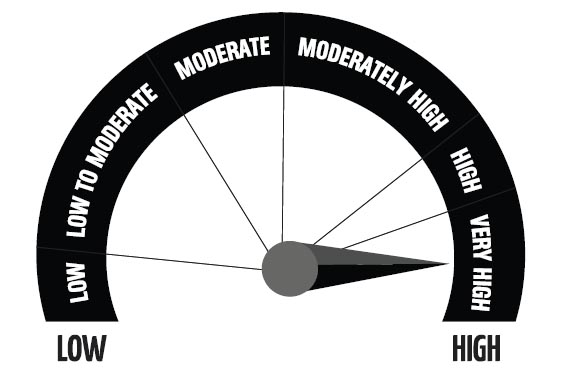
Investors understand that their principal will be at Very High risk
This product is suitable for investors who are seeking*
- To create wealth over long term.
- Investment predominantly in equity and equity related instruments in large and mid-cap companies.
* Investors should consult their financial advisers if in doubt about whether the product is suitable for them.
Benchmark risk-o-meter
NIFTY LargeMidcap 250 TRI
Regular and Direct Plans have different expense structure. Direct Plan shall have a lower expense ratio excluding distribution expenses, commission expenses etc.
*Risk-free rate assumed to be 6.60% (FBIL OVERNIGHT MIBOR as on 31st July 2023). Ratios calculated on the basis of 3 years history of monthly data.
^Portfolio Turnover ratio is calculated as Lower of purchase or sale during the period / Average AUM for the last one year (includes Fixed Income securities and Equity derivatives).
§With effect from 13th March 2023, the name of "IDFC Core Equity Fund" has changed to "Bandhan Core Equity Fund"
