Commentary

Commentary
|
|
|
|
|

|


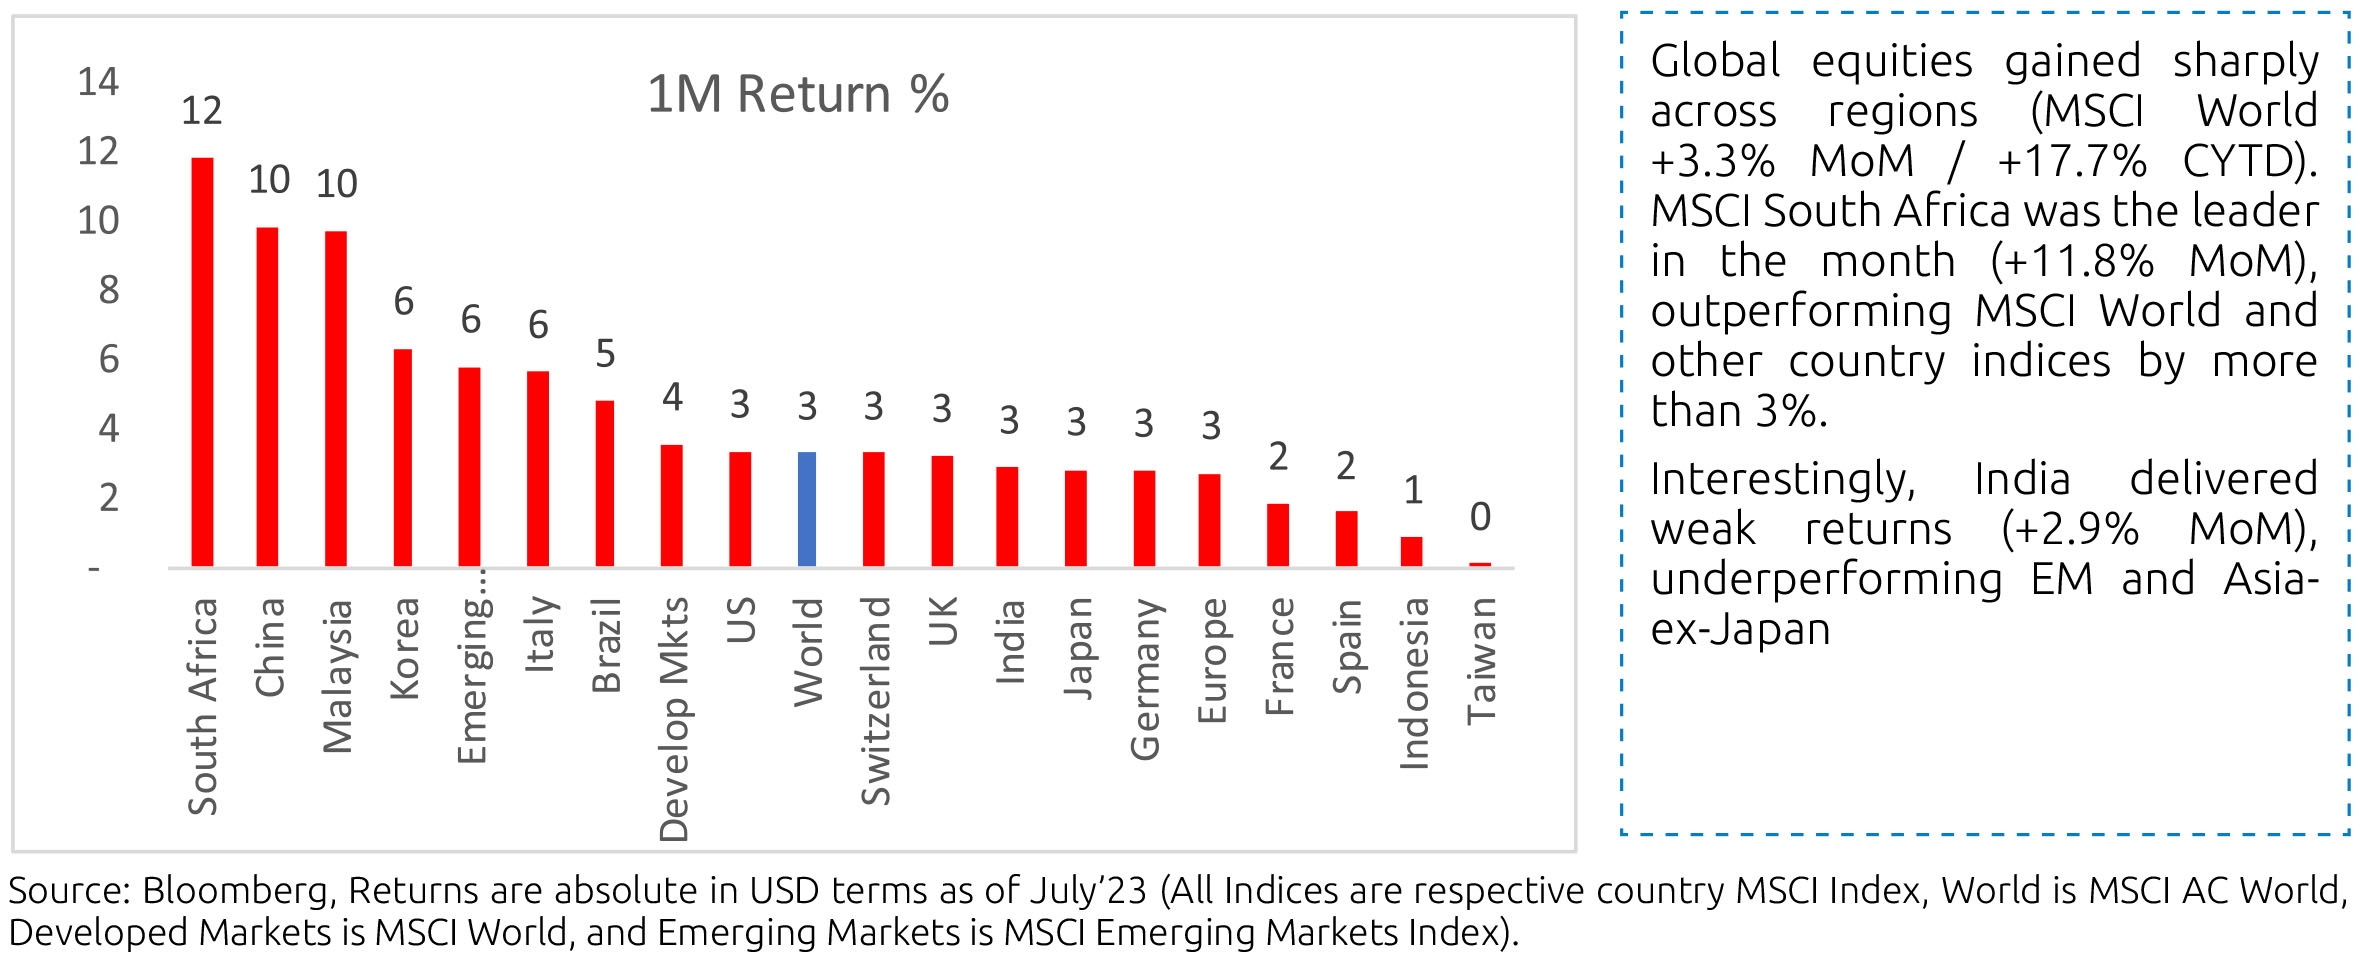
How has the global market performed?
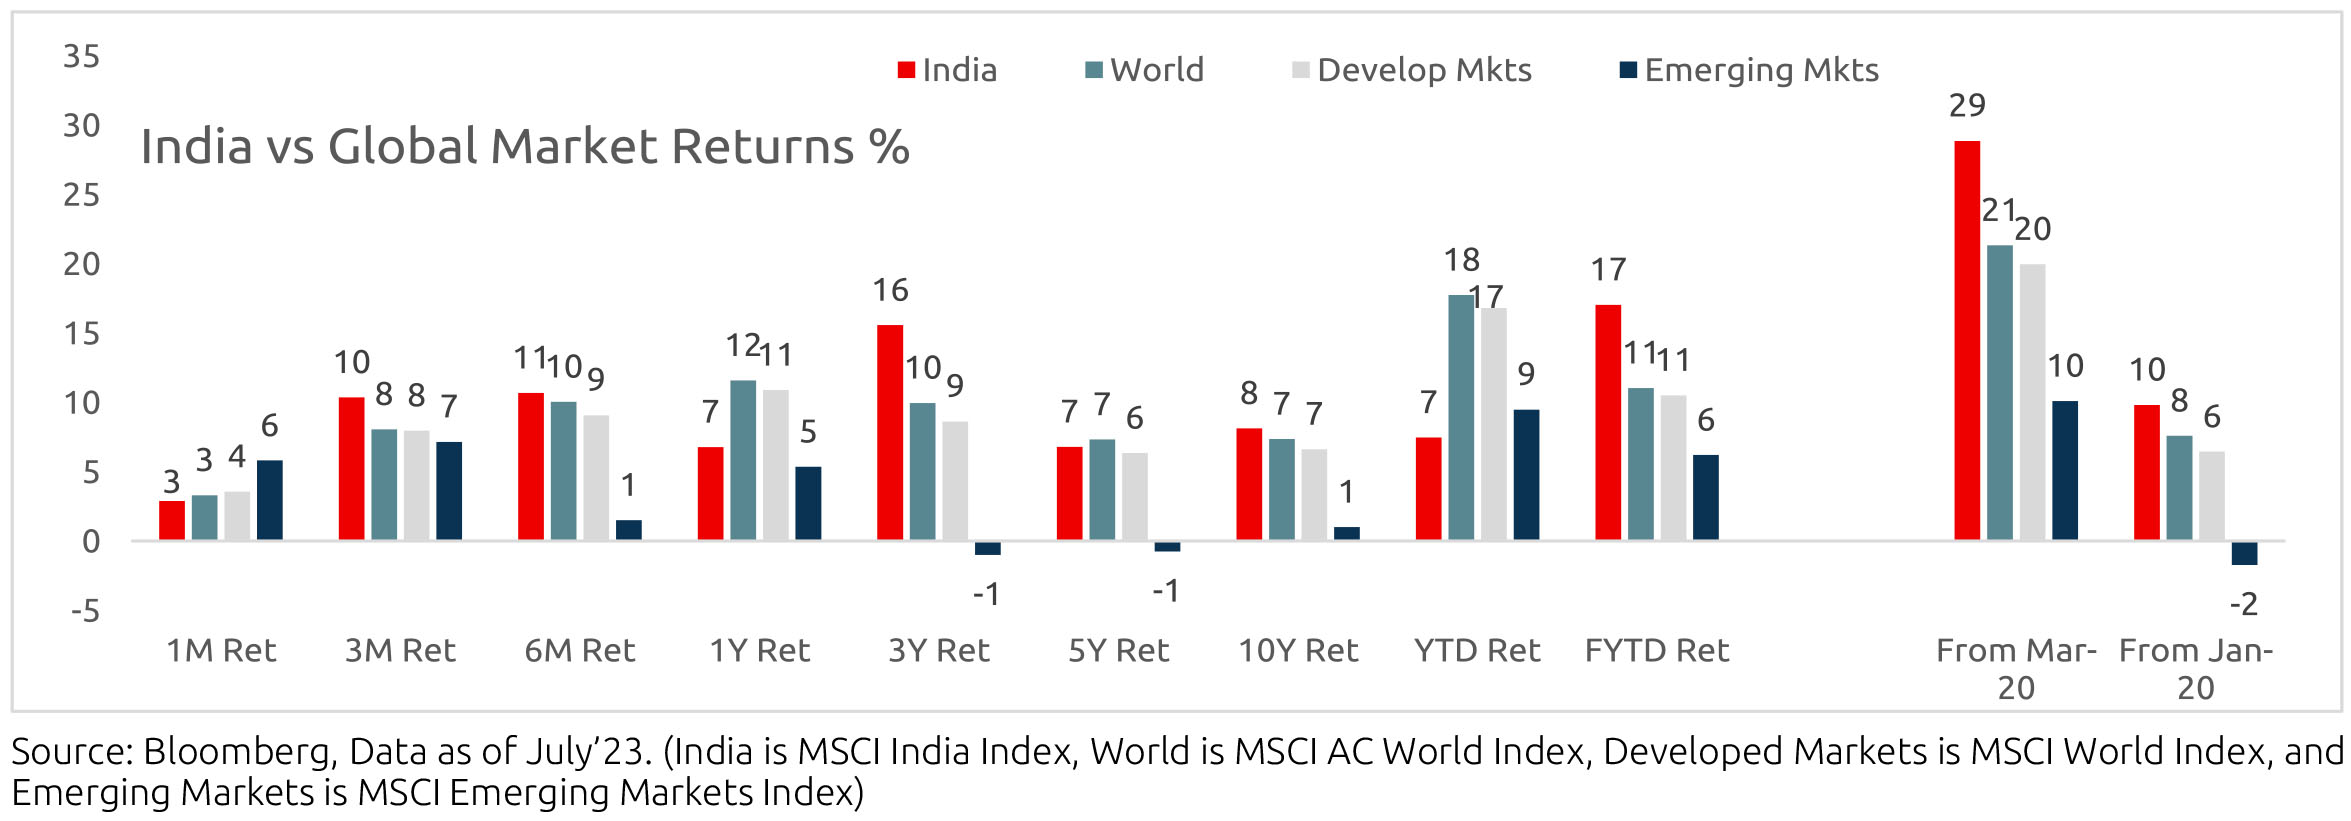
Comparative: India continues to perform better on a 3- and 6-months basis and has bridged the underperformance with global equities on a 1-year return basis.
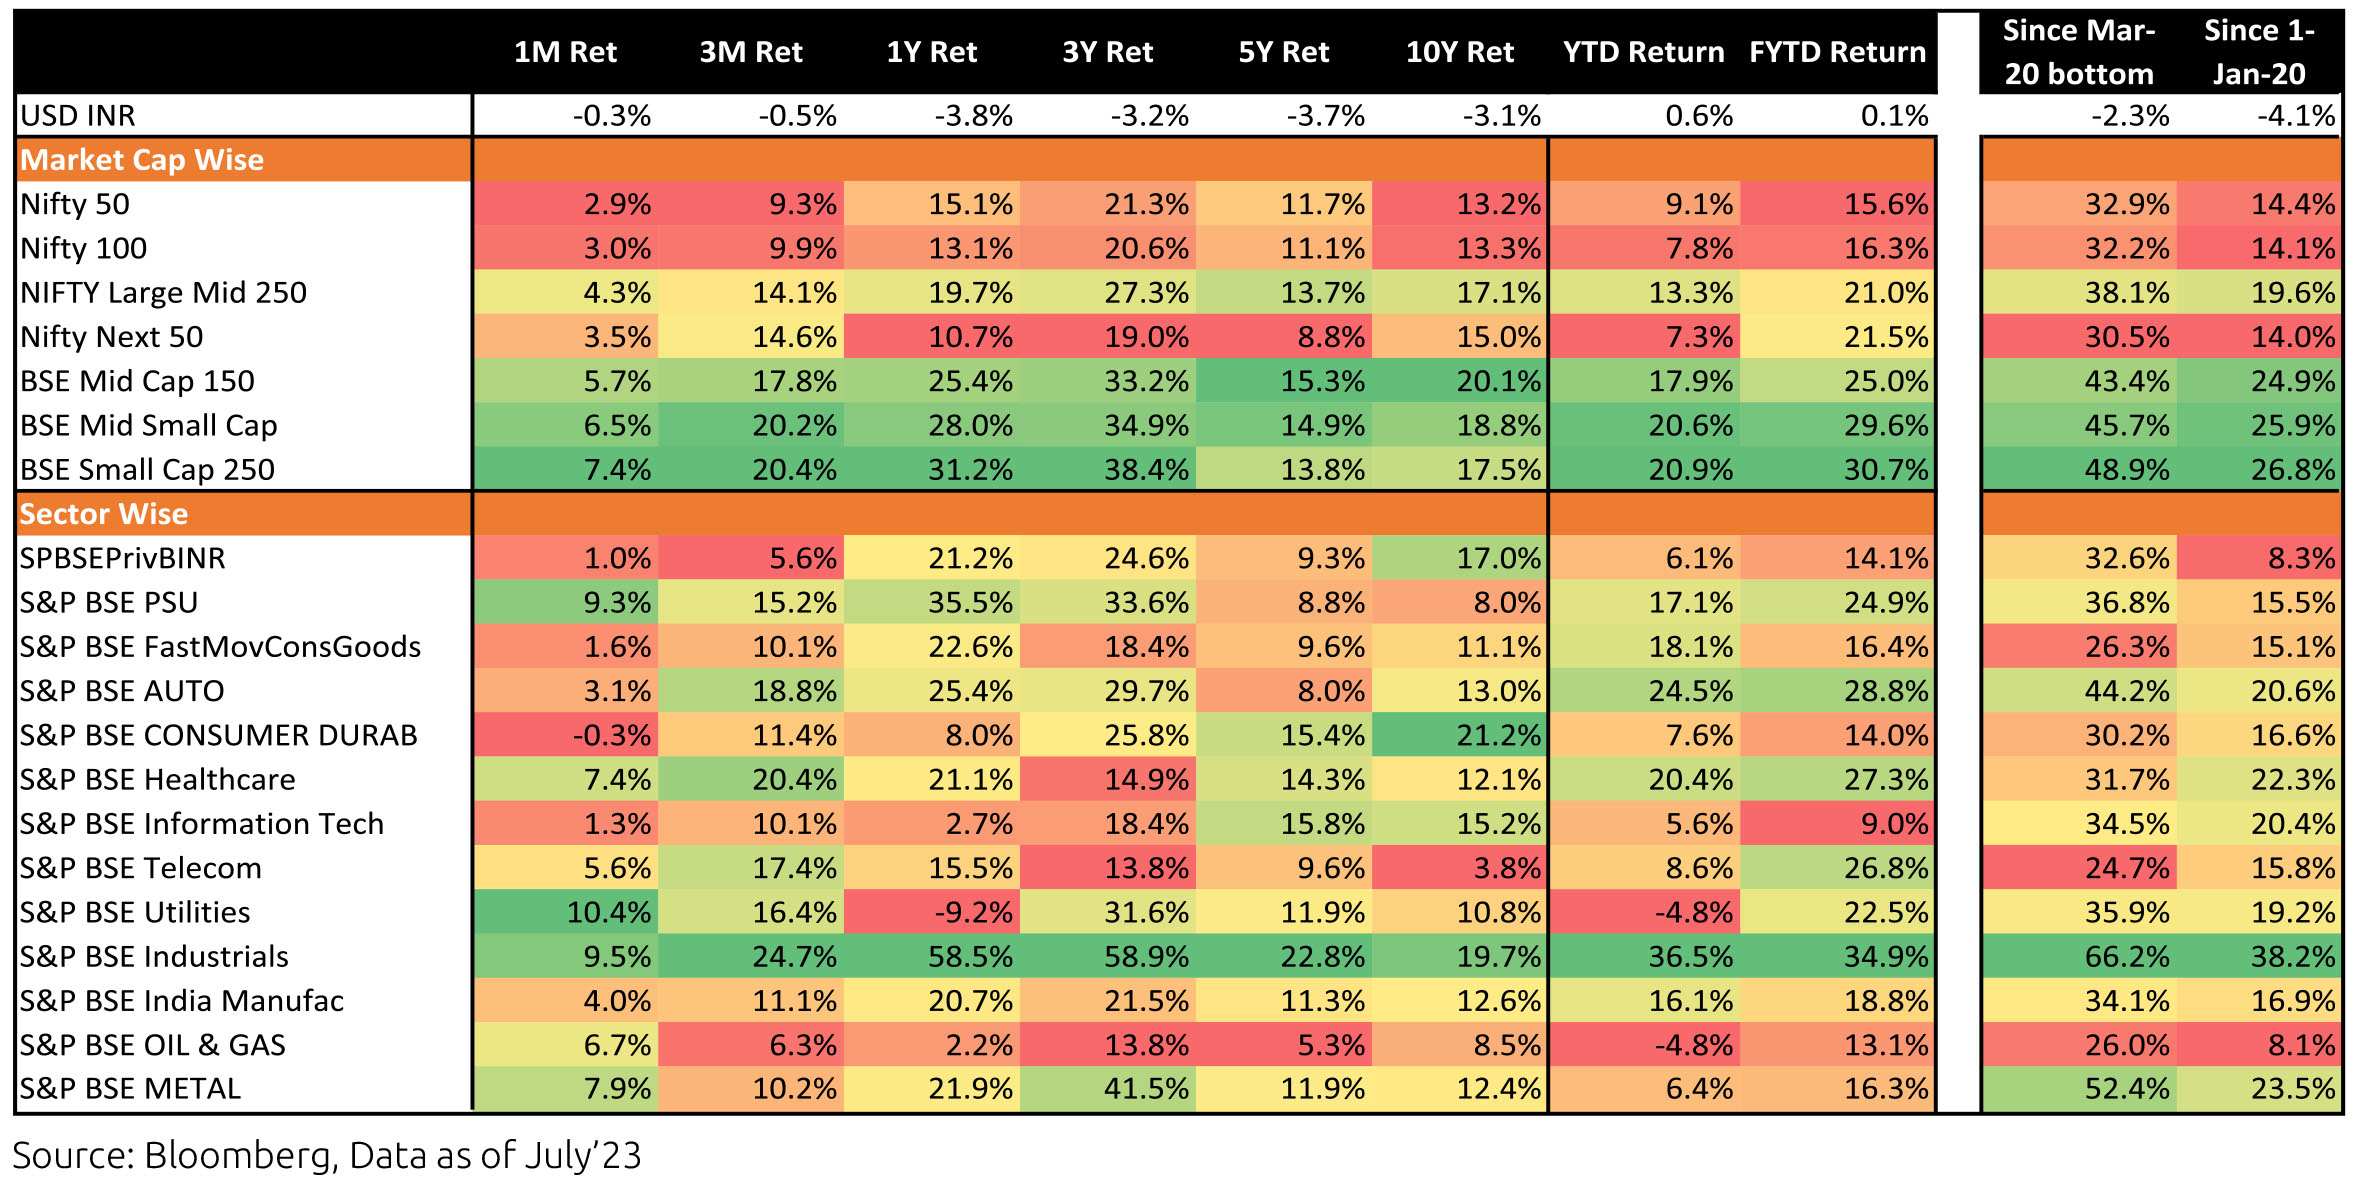
How has the Indian Market performed?
Market Performance
Equity Outlook
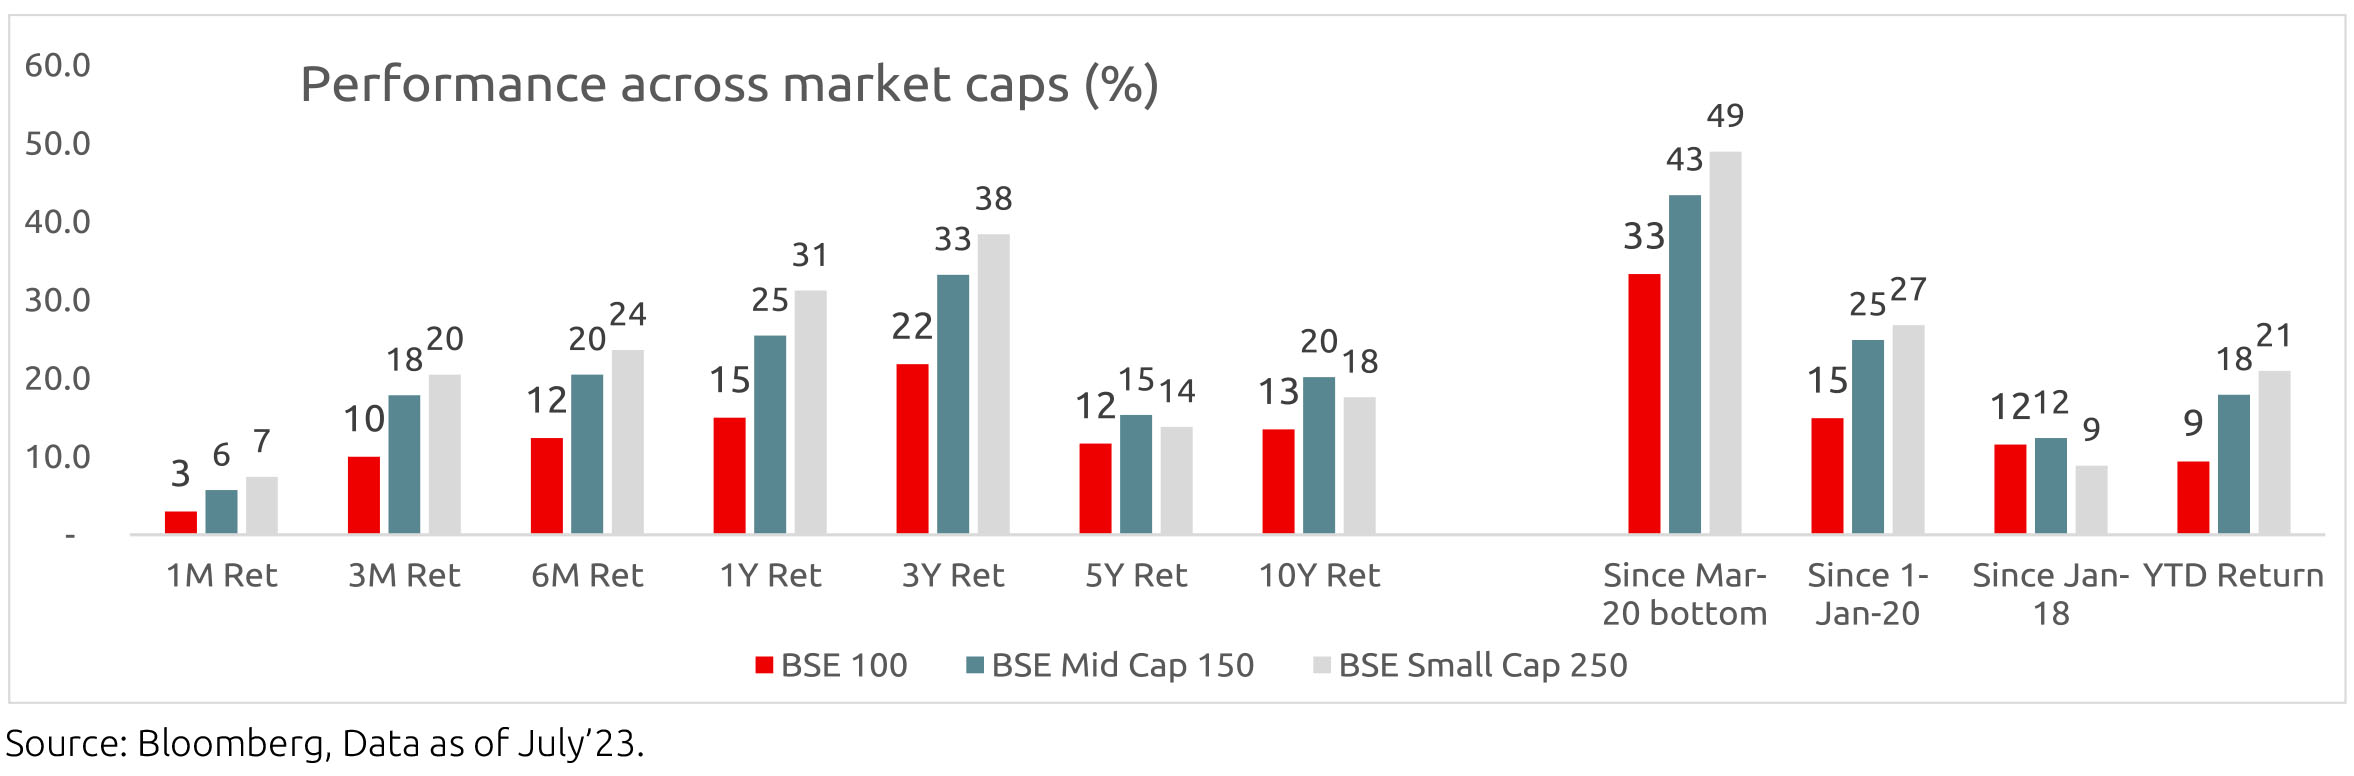
The Indian market has generated healthy returns in the last few months in absolute returns compared to the emerging markets index. The broader market has outperformed large caps by a significant margin in this phase. We believe the key reasons for this are that global growth has held up much better than expectations, with the US economy remaining quite resilient, the weakening of the dollar and China's disappointing growth investors have helped India get a more significant share of foreign flows. We expect most of these factors to sustain in the next few quarters.
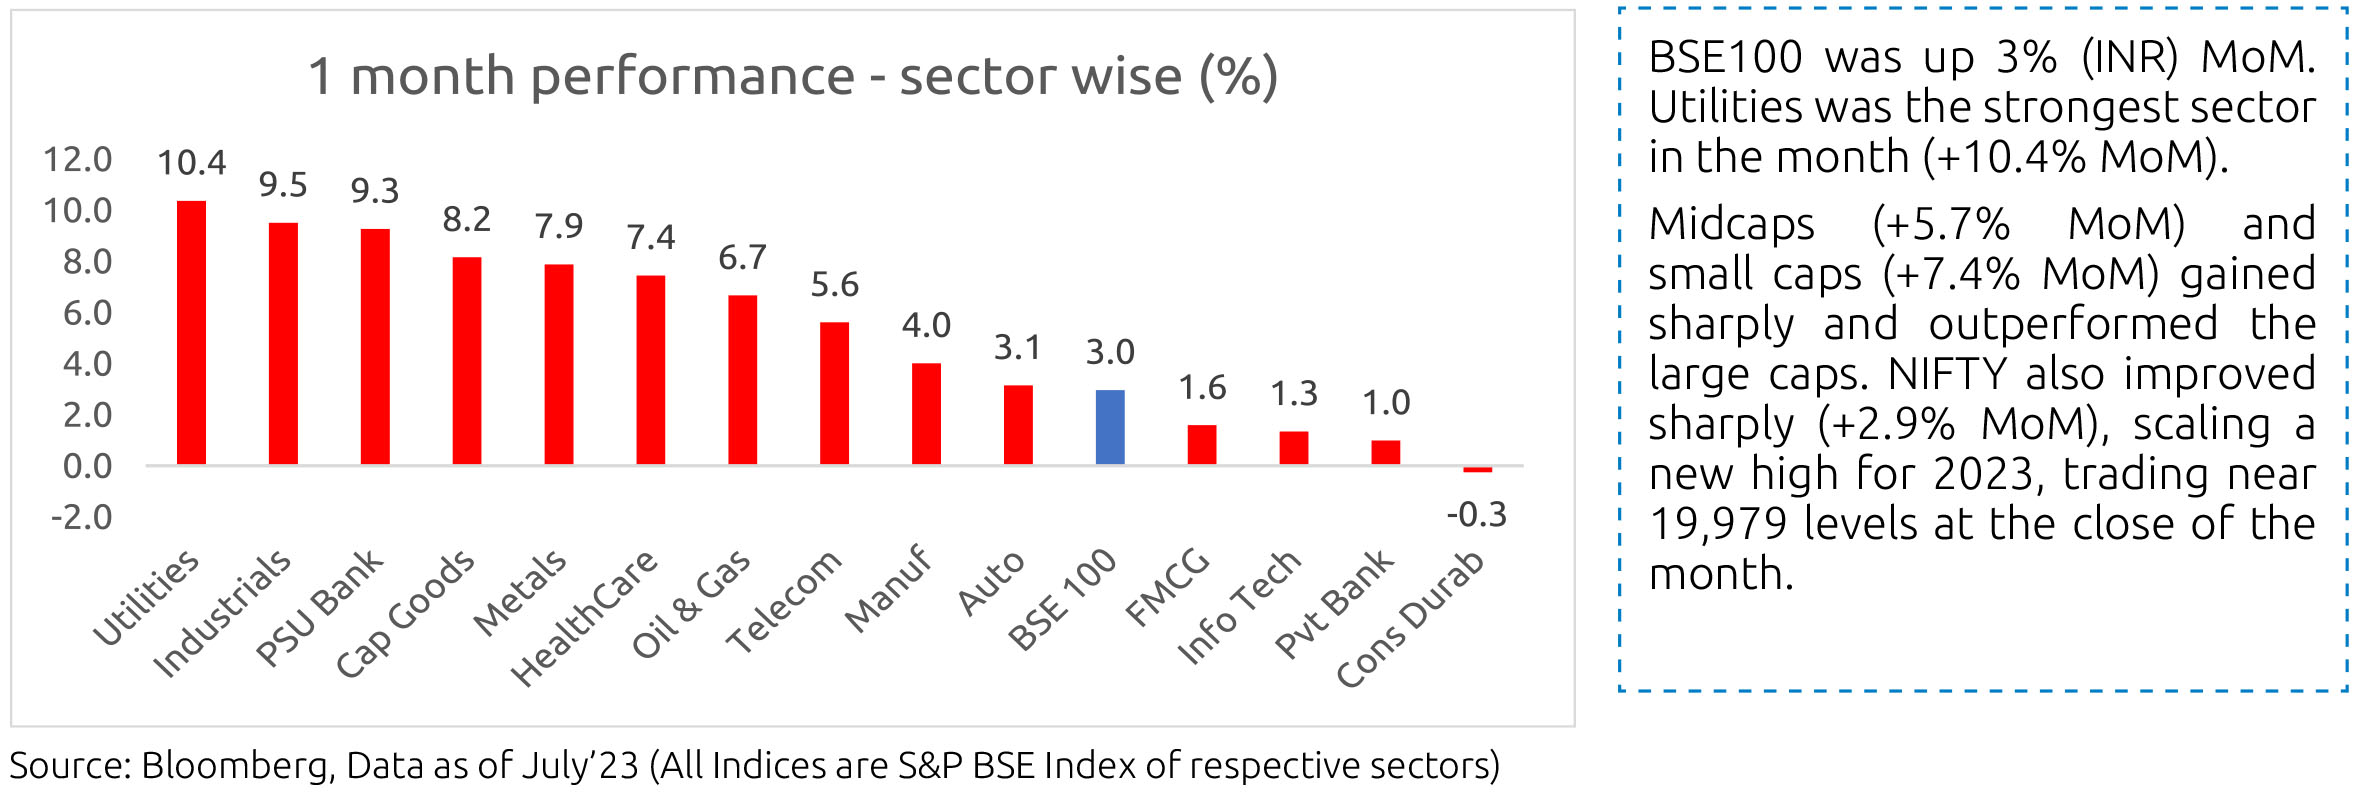
Our overall portfolios are aligned towards playing the domestic economy, and our overweight sectors are auto, financials, industrials, etc. We are seeing momentum in stocks related to power and energy transition as globally, there is a big push towards renewable energy. However, we also expect some volatility in domestic sector stocks as the elections come closer and with crude oil prices climbing up recently, this rally can pause.
Note: The above graph is for representation purposes only and should not be used to develop or implement an investment strategy. Past performance may or may not be sustained in the future.
On central government fiscal data for April-June, net tax revenue growth was down 14.3% y/y as corporate tax inflow was
lower and devolution to states was higher. Total expenditure was up 10.8%y/y, with revenue expenditure growth flat but
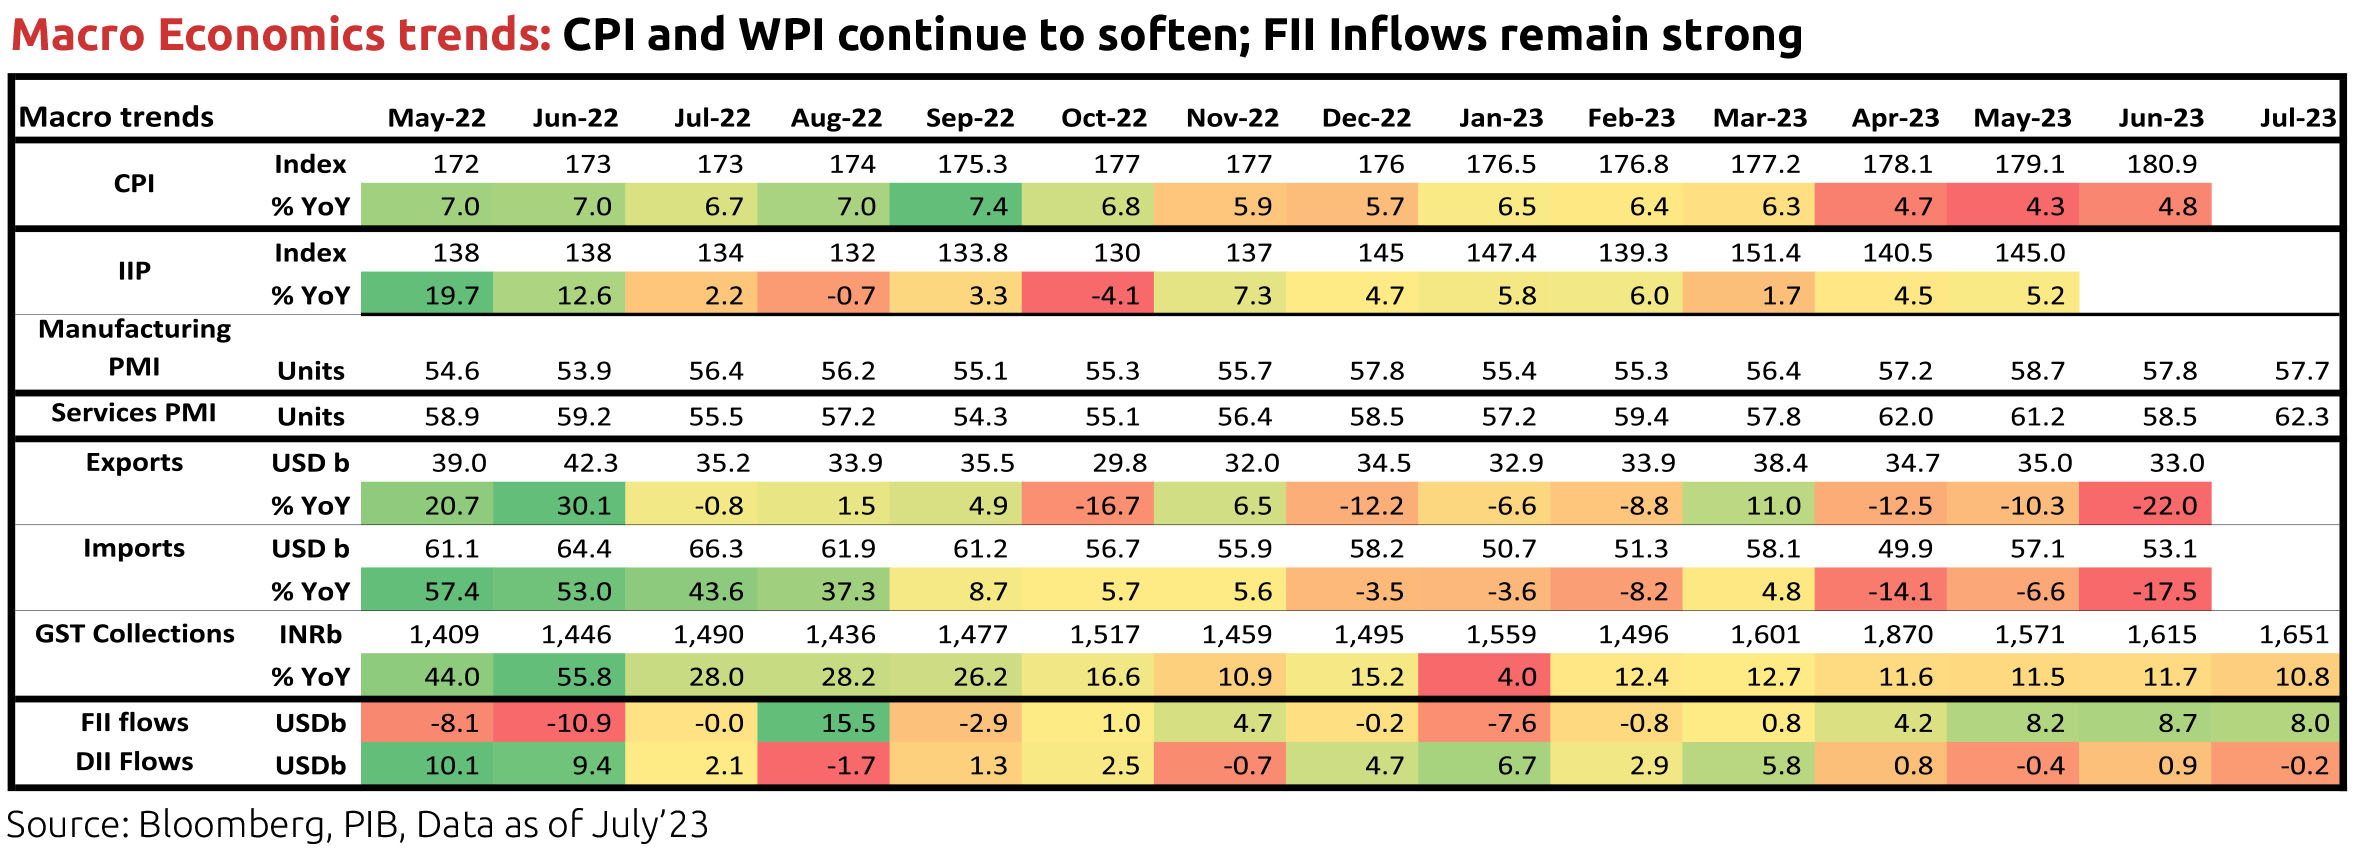
capital expenditure much stronger (59% y/y). GST collection remained robust at Rs. 1.65 lakh crore and 11% y/y in July.
Consumer Price Index (CPI) inflation in India was at 4.8% y/y in June after 4.3% in May. Food and beverages price momentum picked up as prices of pulses, vegetables, egg, spices and meat & fish were strong while that of cereals turned positive. Prices of oils & fats and fruits fell sequentially. Core inflation (CPI excluding food and beverages, fuel and light), which averaged 6.1% in FY23, moderated in recent months and stayed flat at 5.1% in June, also due to base effects. Real time prices of tomatoes have picked up very sharply from July, that of pulses are rising while that of oils & fats are falling. Monsoon rainfall picked up in July, but global agencies continue to assign a high probability for an El Niño occurrence this year. El Niño is typically associated with lesser southwest monsoon rainfall in India, although not a given, and thus potentially lower agriculture production. Various factors impact monsoon season rainfall including other weather phenomenon like the India ocean Dipole. Ultimately, spatial and temporal distribution of rainfall and government supply side measures (rice/wheat trade, open market sales, etc.) matter for agriculture production and food inflation.
Industrial production (IP) growth was 5.2% y/y in May after 4.5% in April. On a seasonally adjusted month-on-month basis, it was +1.2% in May after +3.5% in April. By category, output momentum picked up for primary, capital and intermediate goods while it moderated for infrastructure & construction goods and consumer durable goods. It turned negative for consumer non-durable goods, which had risen sharply in April. Infrastructure Industries output (40% weight in IP) picked up 1.4% m/m (seasonally adjusted) in June, as output in steel and electricity picked up although that in fertilizer's fell.
Bank credit outstanding as on 14th July was at 14.4% y/y (excluding the impact of the merger of a non-bank with a bank), moderating from the recent fortnightly prints and from late October 2022. It has averaged 15.6% so far in calendar year 2023. Similarly, bank deposit growth moderated to 12.3% and has averaged 10.9% so far in 2023. Credit flow in FY23 was much higher than in the previous two financial years with strong flows to personal loans (38% of total flow) and services (33% of total flow). Credit flow so far in FY24 (Apr-June) has also been higher towards services and personal loans.
Merchandise trade deficit for June moderated slightly to USD 20.1bn, after it had picked up to USD 22bn in May from 15.4bn in April. In June, oil exports were down by USD 0.4bn from May and non-oil exports by USD 1.7bn. However, oil imports were also down by USD 3.1bn and non-oil-non-gold imports by USD 2.1bn. This was partially offset by gold imports which increased by USD 1.3bn. Trade deficit, after peaking in September 2022 at USD 28bn, had moderated before the pickup in May 2023. Services trade surplus surprised to the upside from late 2022 with an average monthly surplus of USD 13.4bn in H2 FY23 vs. USD 10.4bn in H1 FY23. However, this has been revised down for recent months and eased to USD 11.2bn in June and USD 11.7bn average in Q1 FY24 from USD 15.5bn in December and USD 13.7bn average in Q4 FY23.
Among higher-frequency variables , number of two-wheelers registered eased after the pickup in October 2022 and has stayed moderate but buoyant recently. Energy consumption levels have picked up recently and averaged 11.5% y/y during the week ending 08 August 2023. Monthly number of GST e-way bills generated picked up to 9.1cr units in March (year-end effect also) and was at 8.8cr in July. It averaged 8.5cr in the March quarter and 8.6cr in the June quarter.
US headline CPI moderated to 3% y/y in June from 4% in May, partly due to base effects. In June, price momentum in energy goods turned positive but food and beverages was weaker, rents moderated further and used vehicles turned negative. Core CPI was at 4.8% in June after 5.3% in May. Sequential momentum in headline CPI was slightly higher but that of Core CPI and non-housing-core-services eased. US non-farm payroll addition in July (187,000 persons) was slightly below expectation and similar to that in June (185,000 persons). However, unemployment rate inched down to 3.5% in July from 3.6% in June, Employment-Population ratio inched up and labour Force Participation Rate stayed flat. Further, sequential growth in average hourly earnings stayed at 0.4% in July (a bit higher than expectation). Non-farm job openings as per the Job Openings and Labor Turnover Survey (JOLTS) was at 9.6mn in May and June, down from 10.3mn in April, and the job-opening-to-hires ratio for the non-farm sector is now 1.62, off the peak of 1.83 in March 2022 but higher than the pre-pandemic average of 1.18 in Jan-Feb 2020. The ADP private sector employment addition for July was also stronger than expected, with 90%+ of the addition being from services and 60%+ only from the leisure/hospitality sector.
In the US banking sector , after the issues in March this year and the Fed responding with liquidity support measures and enabling the takeover of small and regional banks which failed, deposit outflow (particularly from small banks) has stabilized. The FOMC (Federal Open Market Committee), after raising the target range for the federal funds rate in ten consecutive meetings from March 2022 by a total of 500bps, paused at its June meeting and then hiked again by 25bps (to the 5.25-5.50% range) at its July meeting. It welcomed the lower June CPI print but stressed on the need to see further and sustainable progress, said it can hold or hike rates at its September meeting depending on labour and inflation data, that its staff no longer forecasts a US recession and that any rate cuts next year can co-exist with Fed balance sheet size reduction. In June, it had increased its median projection for the fed funds rate for 2023 by 50bps (to 5.6%) and for 2024 by 30bps (to 4.6%).
The European Central Bank's Governing (ECB) Council in its monetary policy decision in July raised all the three key interest rates again by 25bps, a total of 425bps so far in this cycle. It continued to acknowledge weaker growth, and said the momentum in the services sector is now slowing. As the energy crisis fades, it said drivers of inflation is now shifting from external to domestic (i.e. rising wages and robust profit margins) sources. It changed the official statement slightly to 'Our future decisions will ensure that the key ECB interest rates will be set at sufficiently restrictive levels for as long as necessary to achieve a timely return of inflation to our two per cent medium-term target' and said it will remain data-dependent going forward on interest rate decisions. Further, as per the July 2023 Euro Area bank lending survey, credit standards tightened further for all loan categories and demand from firms for loans in Q2 2023 dropped to an all-time low since the start of the survey in 2003, mainly driven by rising interest rates and lower financing needs for fixed investment.
In the August'23 monetary policy, the MPC decided to keep all rates on hold and retained stance as 'withdrawal of accommodation.' The rate decision was unanimous while the stance had the expected dissent from Prof. Varma. Additionally, from the fortnight beginning 12th August, the RBI has levied a temporary incremental cash reserve ratio (I-CRR) on banks of 10% on the increase in their net demand and time liabilities (NDTL) between 19th May and 28th July. The measure will be reviewed on 8th September or earlier with a view to returning the impounded liquidity to the banking system ahead of the festival season.
Outlook
Bond yields have risen reflecting the movement in global bond yields as well as our own recent food inflation dynamics. The August'23 policy soothes some concerns on the margin but these haven't been entirely taken away yet. The market, alongside the RBI, will look at the evolution of food prices with a view to deciding whether October may well throw in a last rate hike in this cycle. In the post policy conference, the Governor also mentioned that should actual policy tools need to get deployed, these tools are not just in terms of rate and stance but there are other ways of dealing with this as well. To us the balance of probability is towards no further hikes in this cycle. Instead, with real policy rates now adequate versus forecasted average inflation and with the RBI taking measures on liquidity, a longish pause may be in the offing. Also the government seems quite proactive in taking supply side steps to the extent possible, including a recent announcement to offload more rice and wheat stocks into the open market.
The I-CRR hike takes out a little above INR 1 lakh crores as per the Governor. This should keep overnight rates more aligned to repo rate going forward. Money market rates may feel some impact as a result. The rest of the curve is already quite flat and there is unlikely to be any significant change in the shape of the curve in the near term. Eventually one should expect some steepening of the curve when market starts to get greater clarity on when to expect the first rate cut. We retain preference for 3 - 6 year segment. While the recent bear flattening has hurt this preference, with the curve now being almost entirely flat we expect this pressure to abate going forward. As always, we will be continually reviewing our positions.
Finally, corporate bond spreads have continued to compress, partly reflecting the very heavy net supply of government bonds in the current quarter. For context, the net government bond supply in this quarter is approximately 41% of the full year's net supply. This drops meaningfully to less than half this amount for the next 2 quarters. We expect this to start to widen corporate bond spreads somewhat over the second half of the year. Subject to scheme mandates, we are overweight government bonds versus corporate bonds in light of this view.
