Bandhan Sterling Value Fund§
An open ended equity scheme following a value investment strategy

Bandhan Sterling Value Fund§
An open ended equity scheme following a value investment strategy
|
|
|
|
|

|


About the Fund: Bandhan Sterling Value Fund is a value fund that focuses on active stock selection strategy.
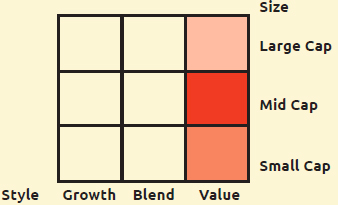
Category: Value
 : ₹ 5,955.00 Crores
AUM or assets under management refers to the recent / updated cumulative market value of investments managed by a mutual fund or any investment firm.
: ₹ 6,122.31 Crores
AUM or assets under management refers to the recent / updated cumulative market value of investments managed by a mutual fund or any investment firm.
:
An employee of the asset management company such as a mutual fund or life insurer, who manages investments of the scheme. He is usually part of a larger team of fund managers and research analysts.
Other Parameter:
| Beta
Beta is a measure of an investment's volatility vis-a-vis the market. Beta of less than 1 means that the security will be less volatile than the market. A beta of greater than 1 implies that the security's price will be more volatile than the market. | 0.94 |
| R Square | 0.70 |
| Standard Deviation (Annualized)
Standard deviation is a statistical measure of the range of an investment's performance. When a mutual fund has a high standard deviation, its means its range of performance is wide, implying greater volatility. | 16.39% |
| Sharpe*
The Sharpe Ratio, named after its founder, the Nobel Laureate William Sharpe, is a measure of risk-adjusted returns. It is calculated using standard deviation and excess return to determine reward per unit of risk. | 2.02 |
| Portfolio Turnover | |
| Equity | 0.13 |
| Aggregate^ | 0.17 |
| Total Expense Ratio | |
| Regular | 1.84% |
| Direct | 0.80% |
SIP (Minimum Amount): ₹ 100/- (Minimum 6 instalments)
SIP Frequency: Monthly/Quarterly (w.e.f. 09-11-2022)
SIP Dates (Monthly/Quarterly)@@: Investor may choose any day of the month except 29th, 30th and 31st as the date of instalment.
Investment Objective: Click here
Minimum Investment Amount : ₹ 1,000/- and any amount thereafter
Option Available: Growth, IDCW@ (Payout, Reinvestment and Sweep (from Equity Schemes to Debt Schemes only))
:
Exit load is charged at the time an investor redeems the units of a mutual fund. The exit load is deducted from the prevailing NAV at the time of redemption. For instance, if the NAV is ₹ 100 and the exit load is 1%, the redemption price would be ₹ 99 per unit.
from the date of allotment:
► Upto 10% of investment:Nil,
► For remaining investment: 1% of applicable NAV.
• If redeemed / switched out after 365 days from date
of allotment: Nil. (w.e.f. May 08, 2020)
NAV (₹) as on June 30, 2023
| Regular Plan | Growth | 103.78 |
| Regular Plan | IDCW@ | 33.91 |
@@If SIP day falls on a non-business day, the SIP transaction shall be processed on the next business day.
^^Mr. Anoop Bhaskar was managing this Scheme till 27th January 2023.
| Name | % of NAV |
| Equity and Equity related Instruments | 95.53% |
| Banks | 18.47% |
| oICICI Bank | 4.58% |
| oAxis Bank | 4.52% |
| oHDFC Bank | 3.06% |
| oState Bank of India | 2.34% |
| IndusInd Bank | 2.13% |
| Bank of Baroda | 1.83% |
| Pharmaceuticals & Biotechnology | 7.76% |
| Cipla | 1.91% |
| Sun Pharmaceutical Industries | 1.72% |
| Dr. Reddy's Laboratories | 1.26% |
| Lupin | 1.11% |
| Laurus Labs | 1.02% |
| IPCA Laboratories | 0.75% |
| IT - Software | 6.59% |
| Tata Consultancy Services | 2.16% |
| HCL Technologies | 1.94% |
| Tech Mahindra | 1.29% |
| Zensar Technologies | 1.20% |
| Auto Components | 4.97% |
| UNO Minda | 2.28% |
| Bosch | 1.56% |
| Wheels India | 1.13% |
| Electrical Equipment | 4.94% |
| oCG Power and Industrial Solutions | 2.78% |
| KEC International | 2.16% |
| Finance | 4.33% |
| oPoonawalla Fincorp | 2.28% |
| Mahindra & Mahindra Financial Services | 1.10% |
| Mas Financial Services | 0.95% |
| Ferrous Metals | 4.08% |
| oJindal Steel & Power | 2.85% |
| Kirloskar Ferrous Industries | 1.23% |
| Petroleum Products | 3.68% |
| oReliance Industries | 2.29% |
| Bharat Petroleum Corporation | 1.39% |
| Automobiles | 3.41% |
| Hero MotoCorp | 1.76% |
| Tata Motors | 1.65% |
| Leisure Services | 3.37% |
| The Indian Hotels Company | 2.18% |
| EIH | 1.19% |
| Industrial Products | 3.23% |
| Graphite India | 1.16% |
| Name | % of NAV |
| Polycab India | 1.04% |
| Bharat Forge | 1.03% |
| Cement & Cement Products | 3.03% |
| The Ramco Cements | 1.81% |
| Nuvoco Vistas Corporation | 1.05% |
| Sagar Cements | 0.17% |
| Diversified FMCG | 2.95% |
| oITC | 2.95% |
| Consumer Durables | 2.78% |
| Greenpanel Industries | 1.65% |
| Mayur Uniquoters | 0.81% |
| Voltas | 0.32% |
| Beverages | 2.48% |
| Radico Khaitan | 1.70% |
| United Spirits | 0.78% |
| Transport Services | 2.39% |
| oVRL Logistics | 2.39% |
| Insurance | 2.11% |
| ICICI Lombard General Insurance Company | 2.11% |
| Construction | 1.85% |
| NCC | 1.85% |
| Personal Products | 1.77% |
| Godrej Consumer Products | 1.77% |
| Power | 1.70% |
| NTPC | 1.70% |
| Food Products | 1.60% |
| Avanti Feeds | 1.60% |
| Chemicals & Petrochemicals | 1.53% |
| Deepak Nitrite | 1.53% |
| Textiles & Apparels | 1.41% |
| K.P.R. Mill | 1.41% |
| Gas | 1.37% |
| Gujarat Gas | 1.37% |
| Oil | 1.31% |
| Oil & Natural Gas Corporation | 1.31% |
| Retailing | 1.08% |
| V-Mart Retail | 1.08% |
| Non - Ferrous Metals | 0.76% |
| Hindalco Industries | 0.76% |
| Entertainment | 0.58% |
| Zee Entertainment Enterprises | 0.58% |
| Net Cash and Cash Equivalent | 4.47% |
| Grand Total | 100.00% |
| oTop 10 Equity Holdings |
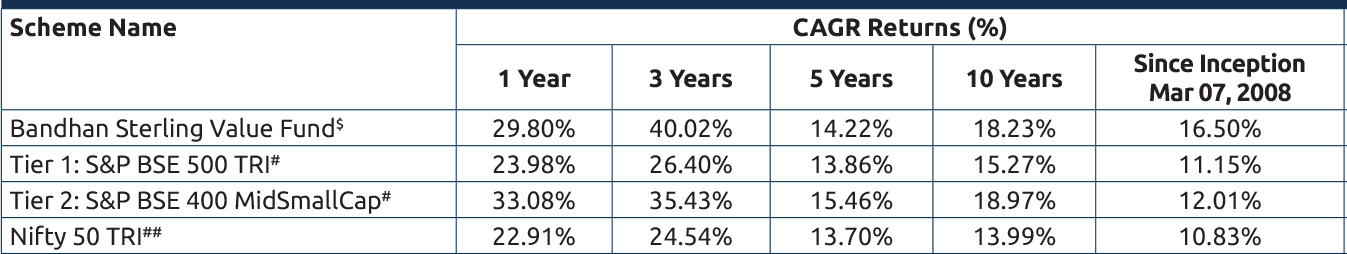
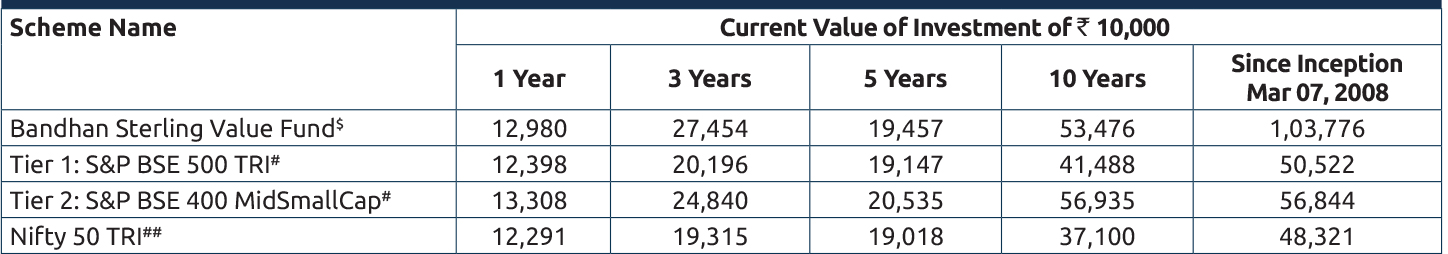
Performance based on NAV as on 30/06/2023. Past performance may or may not be sustained in future.
The performances given are of regular plan growth option.
Click here for other funds managed by the fund manager and refer to the respective fund pages
#Benchmark Returns. ##Alternate Benchmark Returns.
Scheme risk-o-meter
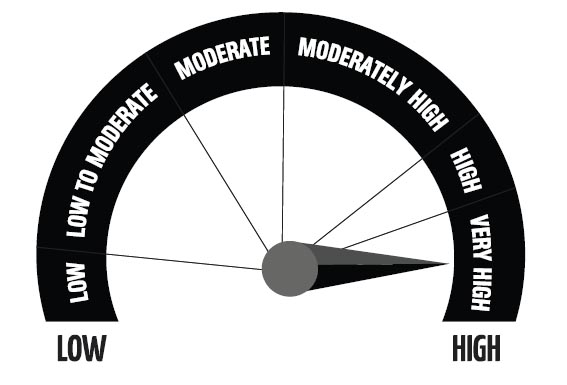
Investors understand that their principal will be at Very High risk
This product is suitable for investors who are seeking*
- To create wealth over long term.
- Investment predominantly in equity and equity related instruments following a value investment strategy.
* Investors should consult their financial advisers if in doubt about whether the product is suitable for them.
Benchmark risk-o-meter
Tier 1: S&P BSE 500 TRI
Benchmark risk-o-meter
Tier 2: S&P BSE 400 MidSmallCap TRI
Regular and Direct Plans have different expense structure. Direct Plan shall have a lower expense ratio excluding distribution expenses, commission expenses etc.
*Risk-free rate assumed to be 6.90% (FBIL OVERNIGHT MIBOR as on 30th June 2023). Ratios calculated on the basis of 3 years history of monthly data.
^Portfolio Turnover ratio is calculated as Lower of purchase or sale during the period / Average AUM for the last one year (includes Fixed Income securities and Equity derivatives).
$The fund has been repositioned from a mid cap fund to a value fund w.e.f. May 28, 2018.
§With effect from 13th March 2023, the name of "IDFC Sterling Value Fund" has changed to "Bandhan Sterling Value Fund"
