Commentary

Commentary
|
|
|
|
|

|


How has the global market performed?
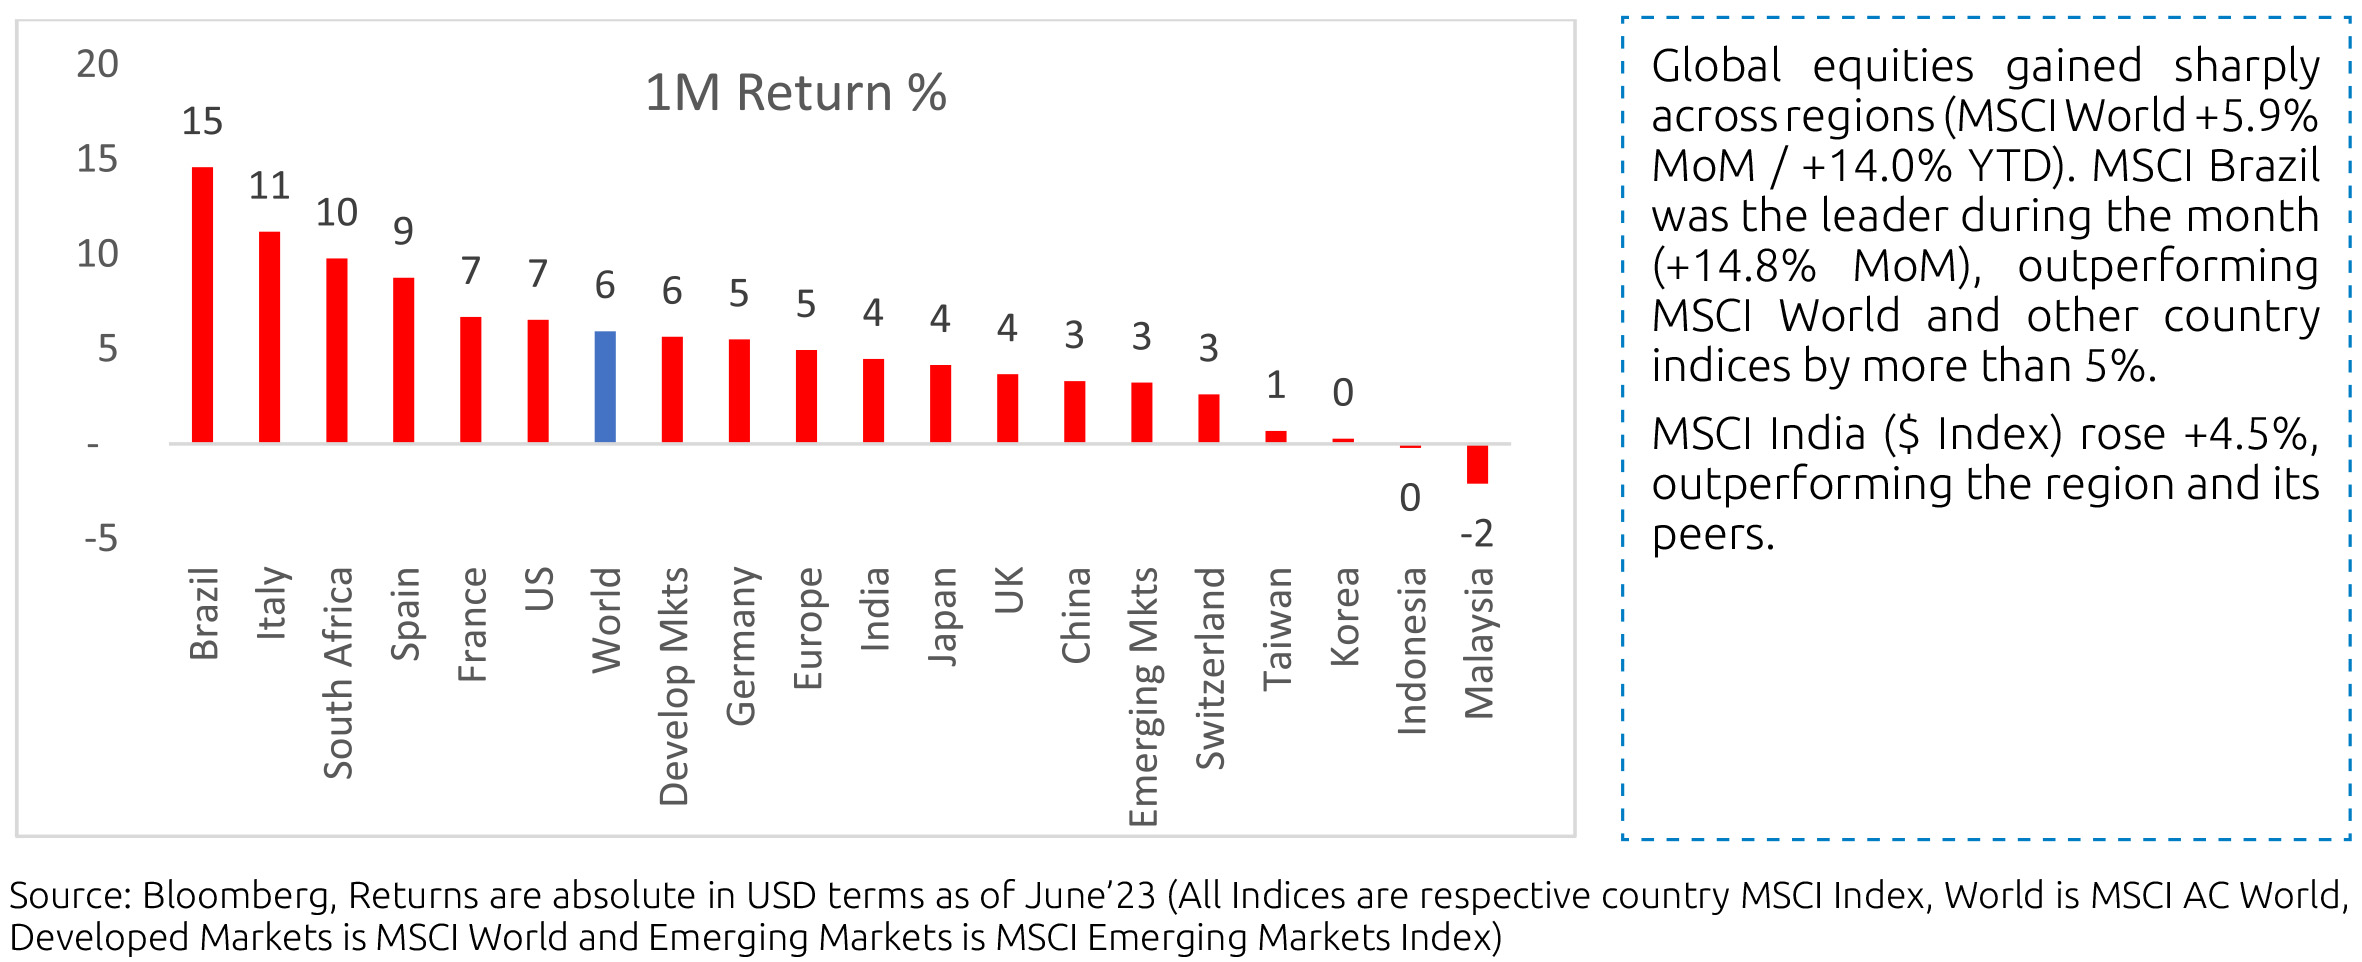
Comparative: Every month, India continues to outperform its region and peers. In the past 3 months, India has bounced back strongly and is holding up well on a 3-year basis.
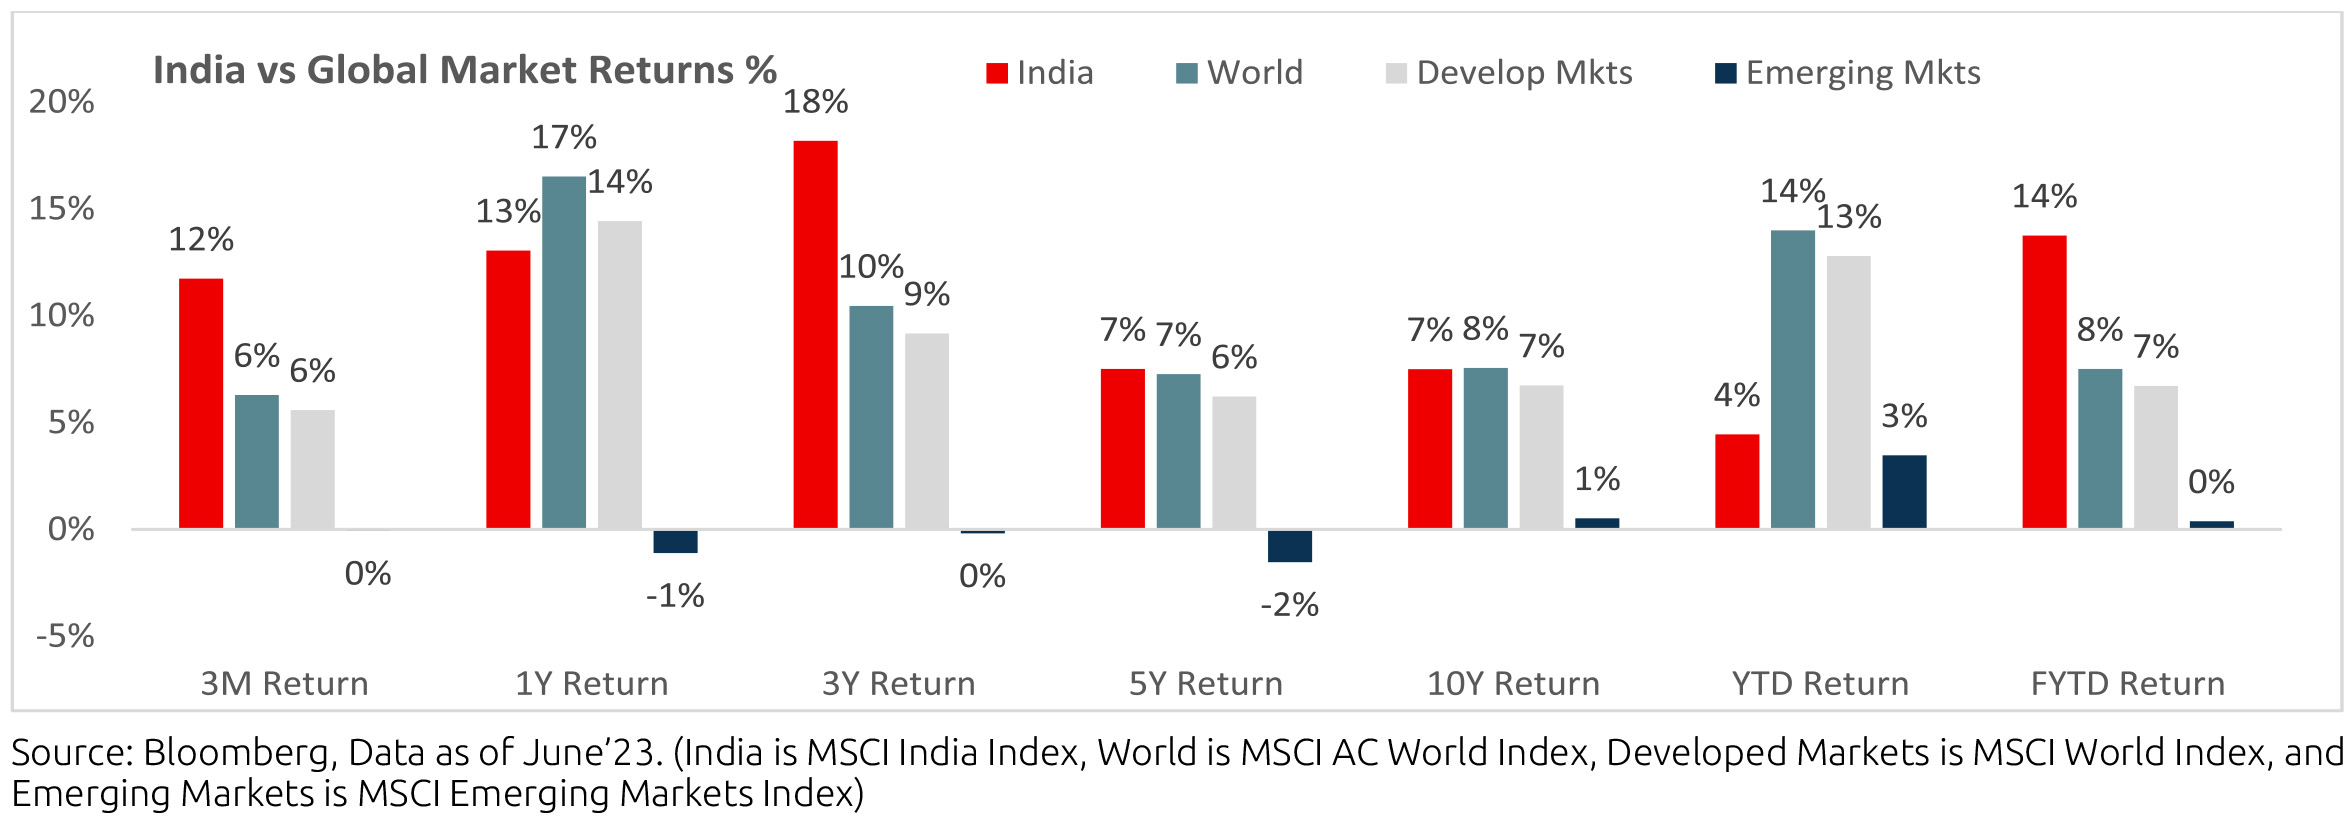
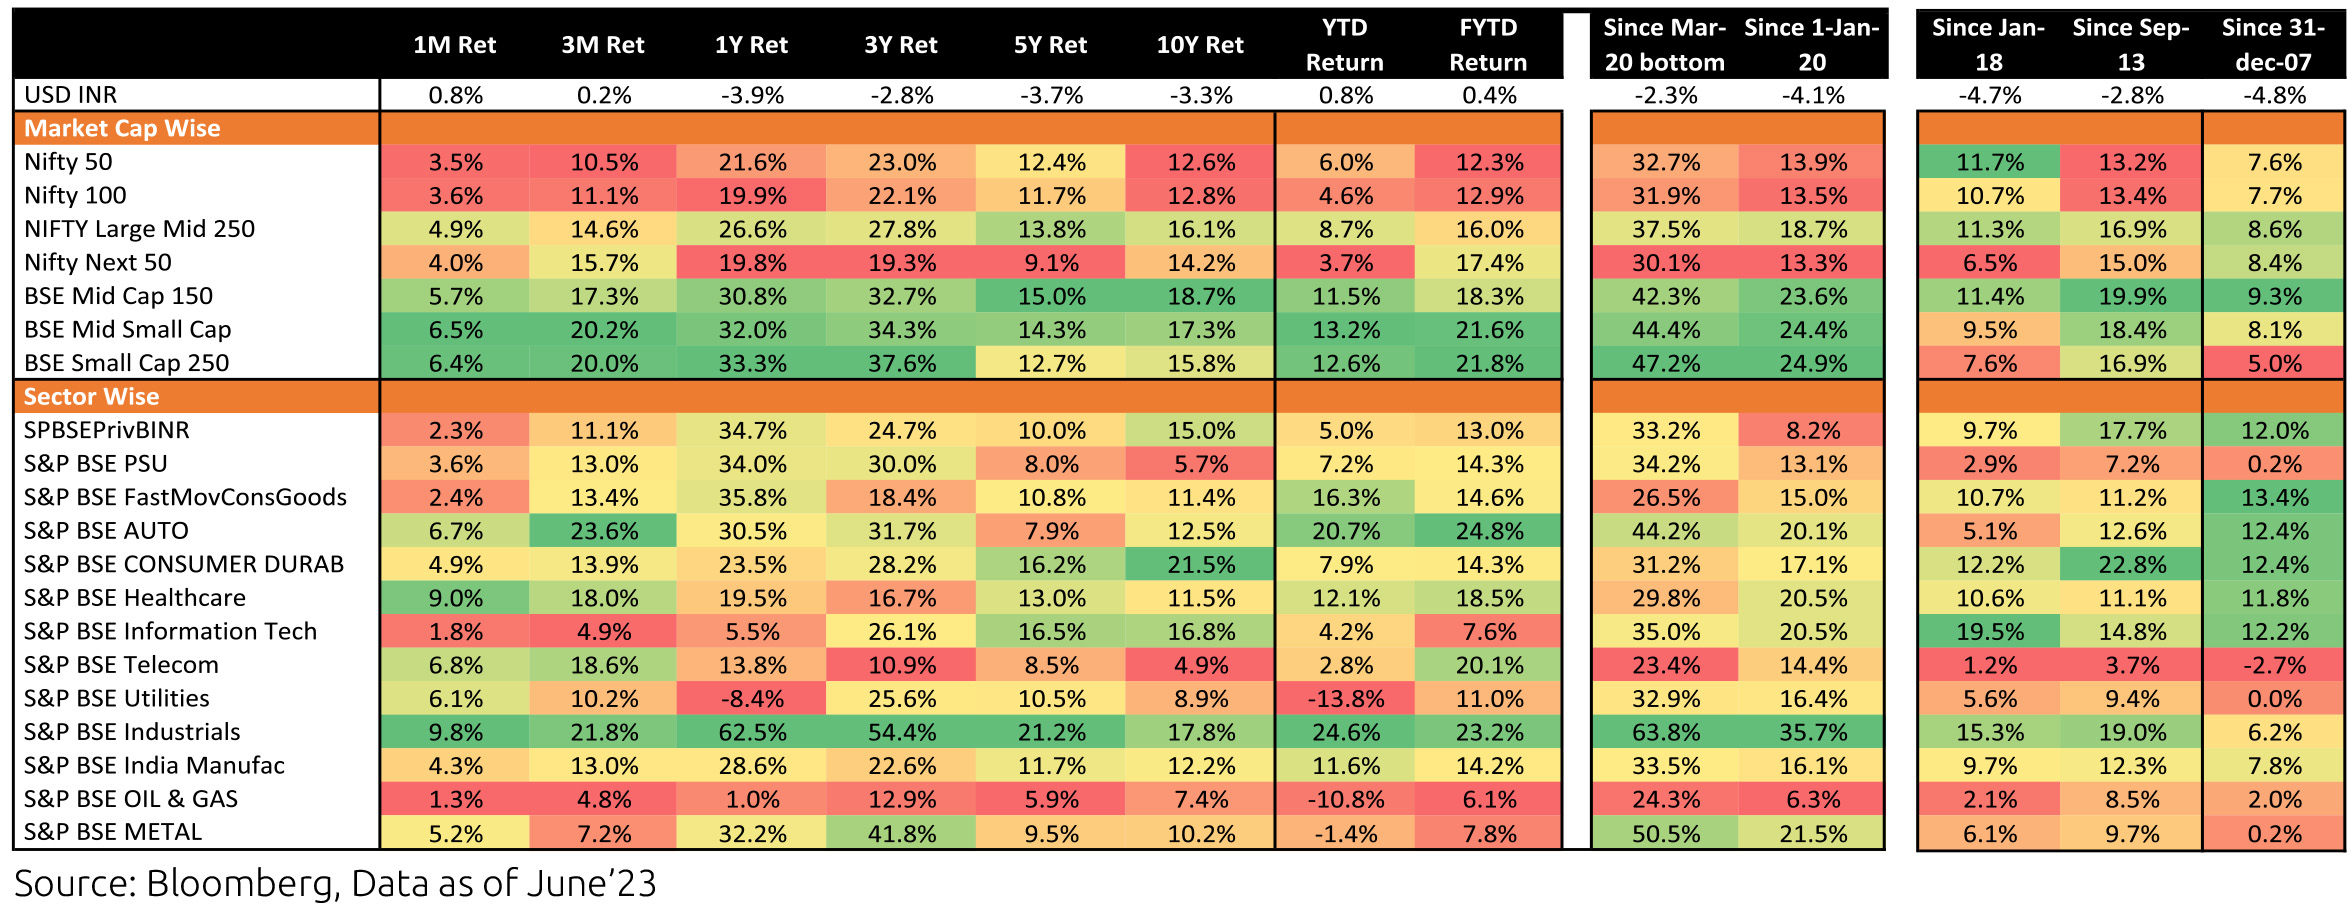
How has the Indian Market performed?
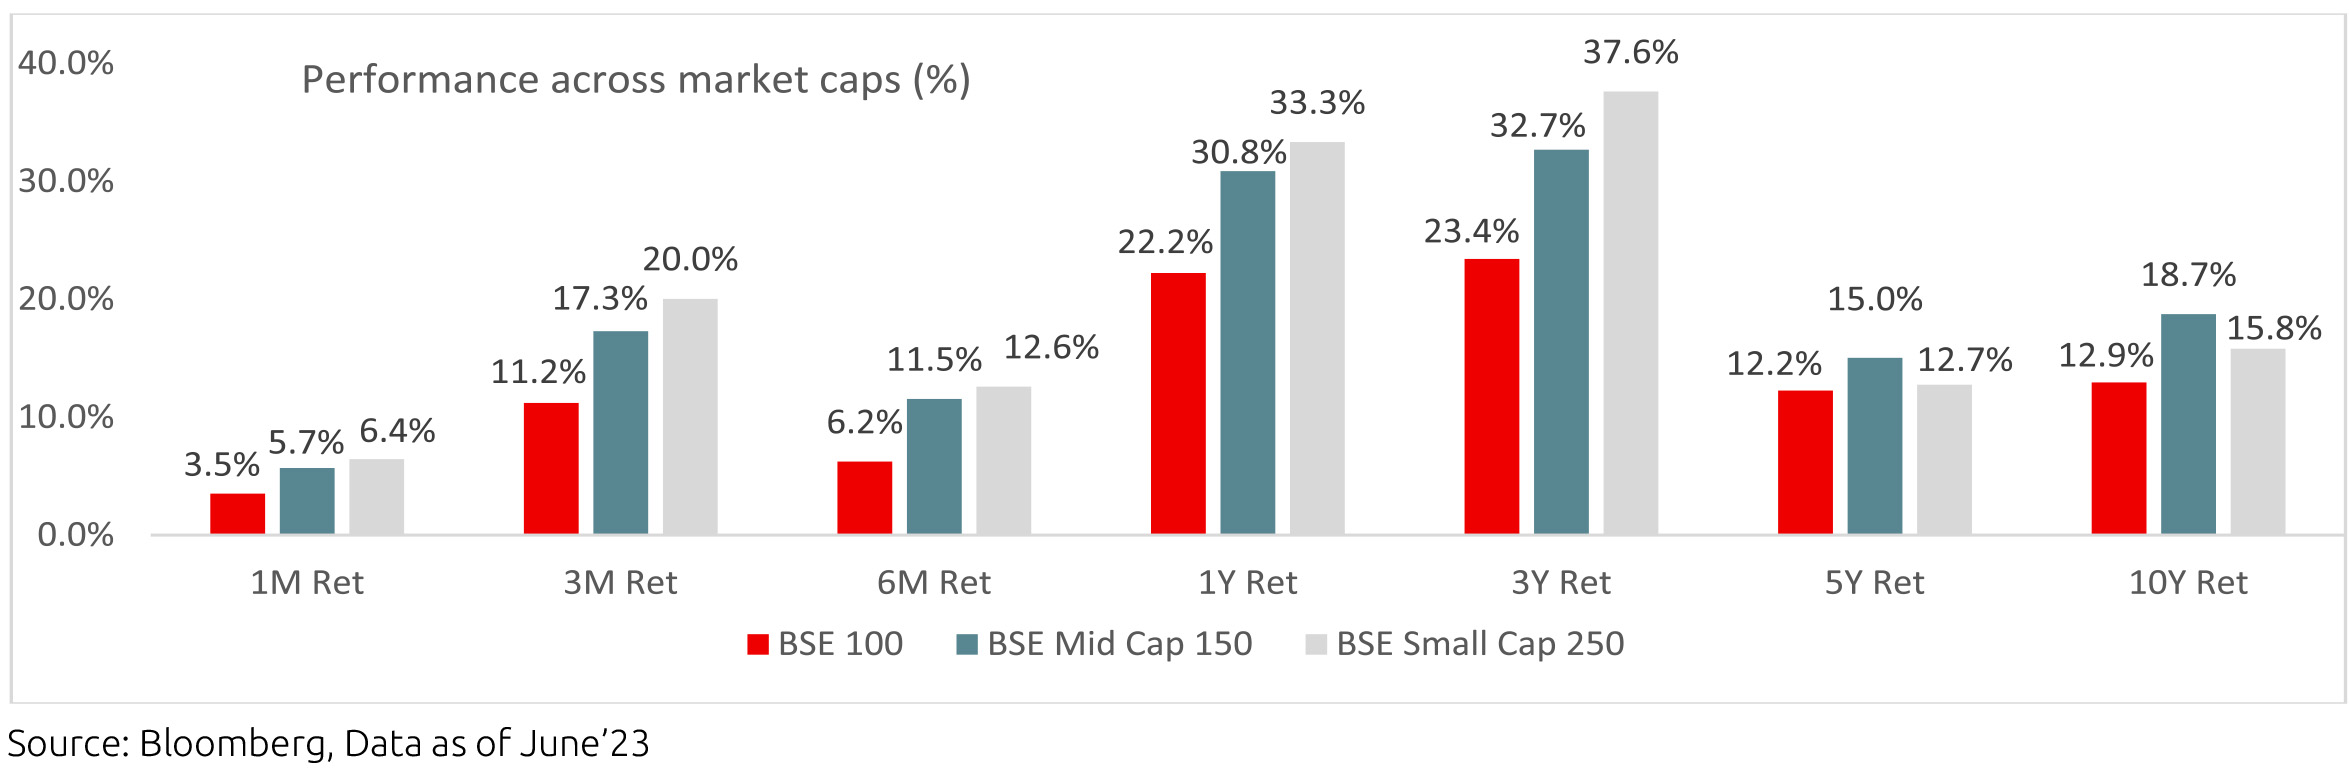
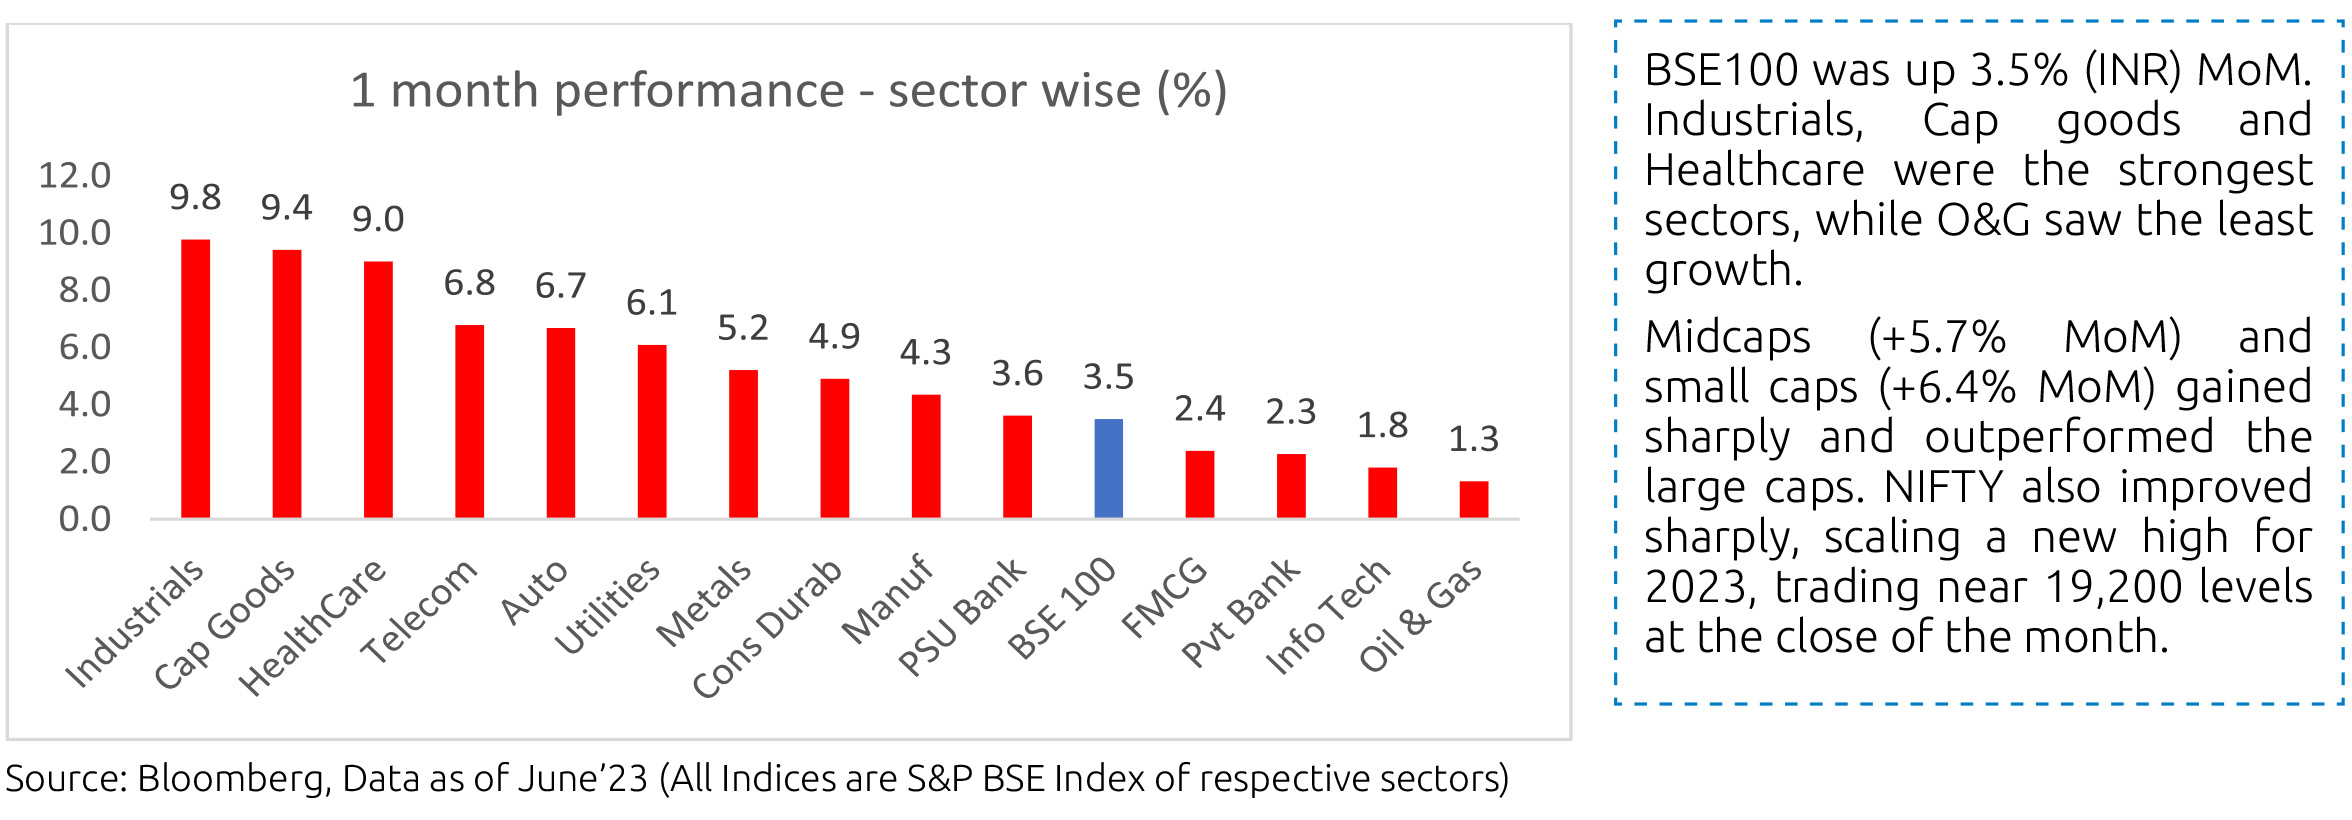
Market Performance
Equity Outlook
The market continued its strong performance in the last month. From a macroeconomic perspective, India is in a sweet spot. The external account benefits from the fall in energy prices and strong services exports, while growth remains steady despite global headwinds. From a flow perspective, India has benefited from two trends - the weakening of the dollar and China's disappointing growth, which has the highest weight in the emerging markets index leading to India getting a more significant share in emerging market flows. These trends are likely to continue in the near term, and while valuations are not cheap, we believe that the favourable macro keeps the market reasonably attractive.
Note: The above graph is for representation purposes only and should not be used to develop or implement an investment strategy. Past performance may or may not be sustained in the future.
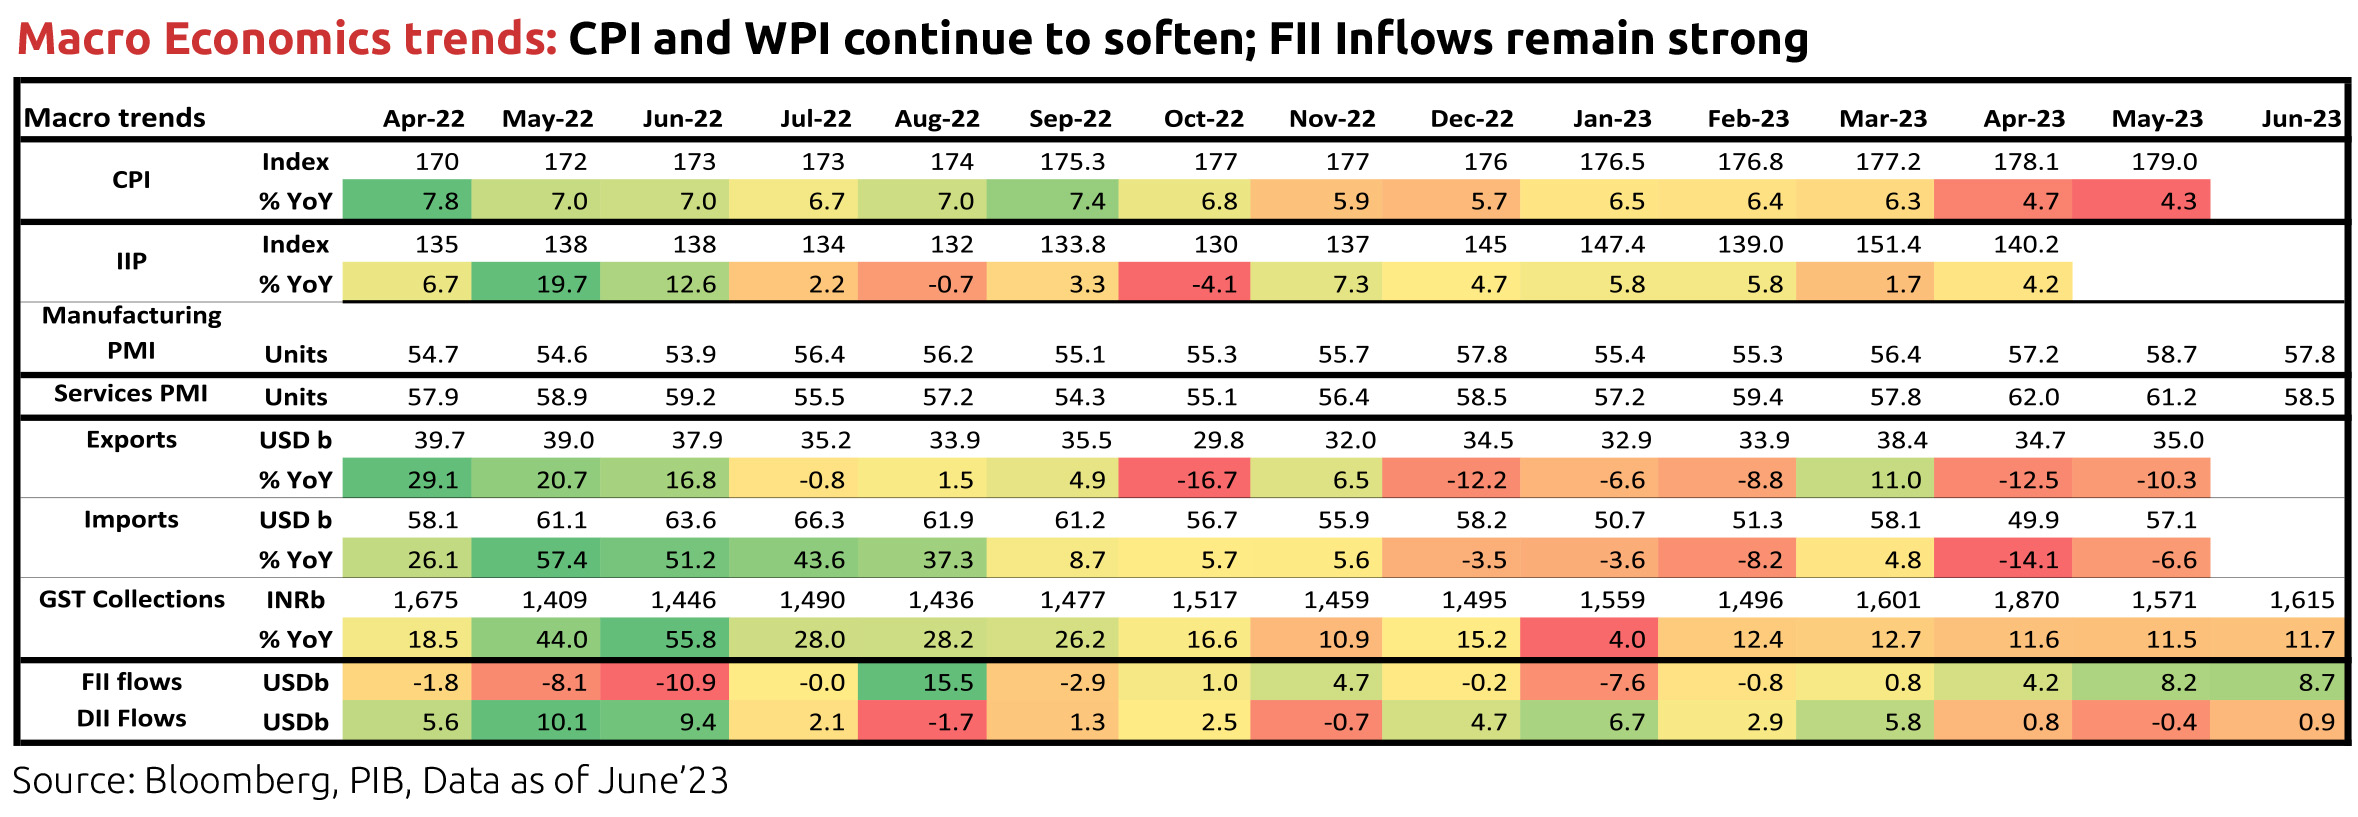
On central government fiscal data for Apr-May, net tax revenue growth was down 9.6% y/y as corporate tax inflow was
lower and devolution to states was higher. Total expenditure was up 6.9%y/y, although revenue expenditure was slightly lower,
because capital expenditure was stronger. GST collection continued to remain robust at Rs. 1.62 lakh crore and 12% y/y in June.
Consumer Price Index (CPI) inflation in India was at 4.3% y/y in May after 4.7% in April. Food and beverages price momentum picked up slightly as prices of pulses, egg, sugar, spices and meat & fish were strong while that of cereals (driven by wheat), fruits and oils & fats fell sequentially. Vegetable price momentum picked up. Core inflation (CPI excluding food and beverages, fuel and light), which averaged 6.1% in FY23, moderated further to 5% in May from 5.2% in April, also due to base effects. Real time prices of tomatoes have picked up very sharply, that of pulses are rising while that of oils & fats are falling. Monsoon rainfall has picked up in India, mainly in the North West region, but global agencies now assign a higher probability for an El Niño occurrence this year. El Niño is typically associated with lesser southwest monsoon rainfall in India, although not a given, and thus potentially lower agriculture production. Various factors impact monsoon season rainfall including other weather phenomenon like the India ocean Dipole. Ultimately, spatial and temporal distribution of rainfall and government supply side measures matter for agriculture production and food inflation.
Industrial production (IP) growth was 4.2% y/y in April after 1.7% in March. On a seasonally adjusted month-on-month basis, it was +3.2% in April after -0.8% in March. By category, output momentum turned negative for capital goods but picked up the others, particularly for consumer non-durable goods which had fallen sharply in March. However, infrastructure Industries output (40% weight in IP) fell 0.9% m/m (seasonally adjusted) in May, driven by fall in output in fertilisers, steel, electricity and cement, after it had turned positive in April.
Bank credit outstanding as on 16th June was at 15.4% y/y, flat in the last four fortnights but moderating from late October 2022. It has averaged 15.7% so far in calendar year 2023. Bank deposit growth was higher at 12.1% and has averaged 10.6% so far in 2023. Credit flow in FY23 was much higher than in the previous two financial years with strong flows to personal loans (39% of total flow) and services (37% of total flow). Credit flow so far in FY24 (Apr-May) has also been higher towards services and personal loans.
Merchandise trade deficit for May increased to USD 22.1bn from USD 15.1bn in April. In May, oil exports were down by USD 0.6bn but non-oil exports were up by USD 0.8bn. However, oil imports were up by USD 0.4bn, gold imports by USD 2.7bn and nonoil- non-gold imports by USD 4.1bn. Trade deficit had picked up from September 2021 and averaged USD 21.4bn till September 2022 (vs. USD 10.8bn during April-August 2021) when non-oil-non-gold imports picked up to an average of USD 38.8bn (vs. USD 29.4bn). Thereafter, it fell from the high of USD 28bn in September 2022, before the pickup in May. Services trade surplus surprised to the upside from late 2022 (average monthly surplus of USD 13bn in H2 FY23 vs. USD 10.4bn in H1 FY23) but has been revised down for recent months and eased to USD 11.6bn in May from USD 15.5bn in December and an average of USD 13bn in Q4 FY23.
India's Current Account Deficit (CAD) for the March 2023 quarter was marginally higher than expectations at 0.2% of GDP, after 2% of GDP in the December quarter. Overall BoP surplus moderated to USD 5.6bn from USD 11.1bn. For FY23, India's CAD was 2% of GDP (1.2% in FY22) and the overall BoP balance was USD -9bn (USD +48bn in FY22).
Among higher-frequency variables, number of two-wheelers registered picked up sharply from October (festive season effect), eased strongly thereafter but has improved more recently. Energy consumption levels picked up from mid-March to mid-April and then fell till end of April but has picked up again now and is currently close to previous year levels. Monthly number of GST e-way bills generated picked up to 9.1cr units in March (year-end effect also) and was at 8.6cr in June. It averaged 8.5cr in the March quarter and 8.6cr in the June quarter.
US headline CPI was at 4% y/y in May, after 4.9% in April, as price momentum in energy goods, recreation and communication turned negative and rents moderated mildly while used vehicle price momentum stayed strong. Core CPI was at 5.3% in May after 5.5% in April. Sequential momentum in headline CPI eased, Core CPI increased and non-housing-core-services was flat. US nonfarm payroll addition in May (339,000 persons) was well above expectation and higher than in April (294,000 persons). However, unemployment rate increased to 3.7% in May from 3.4% in April (based on the household survey), Employment-Population ratio inched down and Labour Force Participation Rate stayed flat. Further, sequential growth in average hourly earnings moderated to 0.3% in May after it had increased to 0.4% in April. Non-farm job openings as per the Job Openings and Labor Turnover Survey (JOLTS), after unexpectedly increasing by 0.6mn to 10.3mn in April, fell again by 0.5mn to 9.8mn in May. Job-opening-to-hires ratio for the non-farm sector is now 1.58, off the peak of 1.83 in March 2022 but higher than the pre-pandemic average of 1.18 in Jan-Feb 2020. The ADP private sector employment addition for June was also much stronger than expected, with 75% of the addition being from services and 47% only from the leisure/hospitality sector.
In response to the banking sector issues in the US from March this year, the Fed responded by introducing a new Bank Term Funding Program (apart from its standing discount window) to provide liquidity to banks and other eligible depository institutions to help meet the demand for its deposits. It also enabled takeover of small and regional banks which failed since then. In terms of data, deposit outflows from banks, particularly small banks, has stabilised. The FOMC (Federal Open Market Committee), after raising the target range for the federal funds rate in ten consecutive meetings from March 2022 by a total of 500bps (to the 5.00-5.25% range), paused at its June meeting citing the need to assess additional information and the cumulative impact of hikes done so far which acts with lags. However, it said nearly all participants view additional policy firming as likely, that July meeting is live, increased its median projection for the fed funds rate for 2023 by 50bps and for 2024 by 30bps.
The European Central Bank's Governing (ECB) Council in its monetary policy decision in June raised all the three key interest rates again by 25bps, a total of 400bps so far in this cycle, and said it will discontinue the reinvestments under the Asset Purchase Programme as of July 2023. It acknowledged weaker growth, easing energy prices and tighter credit conditions but also persistent underlying price pressures and the upside risk to inflation from a tight labour market, particularly in the services sector. It said it has more ground to cover in terms of rate hikes to control inflation, that it will follow a data dependent approach and, barring any material change to its baseline, it will hike again in the next meeting in July.
Outlook
In our view, it is reasonable to say that we are at a mature stage of the current global cycle. This is no revelation since many people are thinking the same way, but nevertheless requires due consideration. Also, to be fair, the cycle seems different for different economies. The largest and second largest ones are at two ends of a spectrum, one wanting to slowdown and the other wanting to accelerate. Nevertheless, and at the risk of painting everything with a large and unwieldy brush, we refer here to a global growth cycle and counter-cycle. While the peak of global growth was already sometime back, it still pretty much feels like the pro-cycle phase as far as the general narratives on growth and inflation are concerned. That is to say, there is still extrapolation of recent trends with momentum adjustments on the margin rather than serious talks of an inflexion point, which is where a cycle becomes a counter-cycle. The reasons why this is so are all sound: US fiscal transfers have held up longer for the consumer, and central banks' balance sheet shrinkage has had notable episodes of reversal which has served to loosen financial conditions. And yet we have been through one of the most aggressive DM rate hike cycles on recent record, large central banks' balance sheets will still be shrinking over time, and the commodity pack is signaling that all is not well in the world. At some point the influence of interest rates on aggregate demand should start to become clearer. All told then, portfolio positioning strongly argues for an overweight on quality fixed income.
The other point to ponder is what is the cost associated in waiting for the narrative to change? As has been shown in the last few months, the ongoing narrative can be persistently sticky with the inflexion always appearing at the unreachable horizon. Given that our yield curve is positive sloping, the carry income on bond investments is better than that earned from the overnight rate. That being the case, the cost of waiting has to then be addressed in terms of volatility; specifically in terms of the likelihood that the additional carry offered by bonds can be realized over a reasonable investment horizon. Given India's notable macro improvement, bond market volatility has become quite manageable. While rate cut expectations are being pushed out here as well, most of the market is comfortable with the idea that the policy rate hike cycle has peaked out. Our view is best expressed as overweight quality bonds up to 6 years' maturity.
