Bandhan Hybrid Equity Fund§
An open ended hybrid scheme investing predominantly in equity and equity related instruments

Bandhan Hybrid Equity Fund§
An open ended hybrid scheme investing predominantly in equity and equity related instruments
|
|
|
|
|

|


Category: Aggressive Hybrid
 : ₹ 584.56 Crores
AUM or assets under management refers to the recent / updated cumulative market value of investments managed by a mutual fund or any investment firm.
: ₹ 588.53 Crores
AUM or assets under management refers to the recent / updated cumulative market value of investments managed by a mutual fund or any investment firm.
:
An employee of the asset management company such as a mutual fund or life insurer, who manages investments of the scheme. He is usually part of a larger team of fund managers and research analysts.
Debt Portion: Mr. Harshal Joshi
^^ Mr. Anoop Bhaskar was managing this Scheme till 27th January 2023.
Other Parameter:
| Standard Deviation (Annualized)
Standard deviation is a statistical measure of the range of an investment's performance. When a mutual fund has a high standard deviation, its means its range of performance is wide, implying greater volatility. | 11.17% | |
| Beta
Beta is a measure of an investment's volatility vis-a-vis the market. Beta of less than 1 means that the security will be less volatile than the market. A beta of greater than 1 implies that the security's price will be more volatile than the market. | 1.02 | |
| R Square | 0.85 | |
| Sharpe*
The Sharpe Ratio, named after its founder, the Nobel Laureate William Sharpe, is a measure of risk-adjusted returns. It is calculated using standard deviation and excess return to determine reward per unit of risk. | 1.42 | |
| Modified Duration ₤
Modified duration is the price sensitivity and the percentage change in price for a unit change in yield | 1.29 years |
| Average Maturity ₤ | 1.42 years |
| Macaulay Duration ₤ | 1.34 years |
| Yield to Maturity ₤
The Yield to Maturity or the YTM is the rate of return anticipated on a bond if held until maturity. YTM is expressed as an annual rate. The YTM factors in the bond's current market price, par value, coupon interest rate and time to maturity. | 7.22% |
| ₤For debt allocation only | |
| Portfolio Turnover | |
| Equity | 0.43 |
| Aggregate^ | 0.88 |
| Total Expense Ratio | |
| Regular | 2.42% |
| Direct | 1.15% |
SIP (Minimum Amount): ₹ 100/- (Minimum 6 instalments)
SIP Frequency: Monthly/Quarterly (w.e.f. 09-11-2022)
SIP Dates (Monthly/Quarterly)@@: Investor may choose any day of the month except 29th, 30th and 31st as the date of installment.
Investment Objective: Click here
Minimum Investment Amount : ₹ 1,000/- and any amount thereafter
Option Available: Growth & IDCW@ (Payout, Reinvestment & Sweep facility)
:
Exit load is charged at the time an investor redeems the units of a mutual fund. The exit load is deducted from the prevailing NAV at the time of redemption. For instance, if the NAV is ₹ 100 and the exit load is 1%, the redemption price would be ₹ 99 per unit.
Remaining investment: 1% if redeemed/switched out within 1 year from the date of allotment
NAV (₹) as on May 31, 2023
| Regular Plan | Growth | 17.88 |
| Regular Plan | IDCW¥ | 15.33 |
@@If SIP day falls on a non-business day, the SIP transaction shall be processed on the next business day.
| Name | Rating | % of NAV |
| Equity and Equity related Instruments | 76.89% | |
| Banks | 17.77% | |
| oHDFC Bank | 5.30% | |
| oICICI Bank | 5.28% | |
| oAxis Bank | 2.34% | |
| oIndusInd Bank | 1.81% | |
| oState Bank of India | 1.80% | |
| Kotak Mahindra Bank | 1.24% | |
| IT - Software | 8.60% | |
| oInfosys | 3.95% | |
| LTIMindtree | 1.56% | |
| Tata Consultancy Services | 1.53% | |
| Zensar Technologies | 0.96% | |
| MphasiS | 0.60% | |
| Finance | 6.29% | |
| oHDFC | 1.67% | |
| Bajaj Finance | 1.42% | |
| SBI Cards and Payment Services | 1.32% | |
| Cholamandalam Invt and Fin Co | 1.13% | |
| M&M Financial Services | 0.75% | |
| Automobiles | 4.88% | |
| Maruti Suzuki India | 1.58% | |
| Tata Motors | 1.33% | |
| Bajaj Auto | 1.07% | |
| Mahindra & Mahindra | 0.90% | |
| Petroleum Products | 4.64% | |
| oReliance Industries | 4.64% | |
| Pharmaceuticals & Biotechnology | 4.29% | |
| Sun Pharmaceutical Industries | 1.09% | |
| IPCA Laboratories | 0.94% | |
| Cipla | 0.76% | |
| Laurus Labs | 0.76% | |
| Dr. Reddy's Laboratories | 0.75% | |
| Diversified FMCG | 2.68% | |
| Hindustan Unilever | 1.54% | |
| ITC | 1.14% | |
| Retailing | 2.41% | |
| Avenue Supermarts | 1.47% | |
| V-Mart Retail | 0.93% | |
| Consumer Durables | 2.31% | |
| Greenpanel Industries | 0.81% | |
| Greenply Industries | 0.81% | |
| Dixon Technologies (India) | 0.69% | |
| Electrical Equipment | 2.31% | |
| Siemens | 1.52% | |
| KEC International | 0.79% | |
| Construction | 2.14% | |
| oLarsen & Toubro | 2.14% | |
| Auto Components | 2.05% | |
| Samvardhana Motherson International | 1.24% | |
| Name | Rating | % of NAV |
| Endurance Technologies | 0.80% | |
| Telecom - Services | 1.99% | |
| oBharti Airtel | 1.99% | |
| Cement & Cement Products | 1.83% | |
| The Ramco Cements | 1.11% | |
| UltraTech Cement | 0.37% | |
| JK Lakshmi Cement | 0.34% | |
| Leisure Services | 1.64% | |
| Jubilant Foodworks | 1.64% | |
| Textiles & Apparels | 1.48% | |
| Page Industries | 1.48% | |
| Insurance | 1.33% | |
| HDFC Life Insurance Company | 1.33% | |
| Power | 1.05% | |
| NTPC | 1.05% | |
| Gas | 1.05% | |
| Gujarat Gas | 1.05% | |
| Oil | 0.93% | |
| Oil & Natural Gas Corporation | 0.93% | |
| Fertilizers & Agrochemicals | 0.83% | |
| PI Industries | 0.83% | |
| Industrial Products | 0.83% | |
| Graphite India | 0.83% | |
| Food Products | 0.79% | |
| Avanti Feeds | 0.79% | |
| Chemicals & Petrochemicals | 0.78% | |
| SRF | 0.78% | |
| Ferrous Metals | 0.71% | |
| Tata Steel | 0.71% | |
| Entertainment | 0.66% | |
| Zee Entertainment Enterprises | 0.66% | |
| Personal Products | 0.62% | |
| Godrej Consumer Products | 0.62% | |
| Certificate of Deposit | 7.92% | |
| Kotak Mahindra Bank | A1+ | 7.92% |
| Government Bond | 7.29% | |
| 7.32% - 2024 G-Sec | SOV | 3.41% |
| 5.63% - 2026 G-Sec | SOV | 1.64% |
| 6.79% - 2027 G-Sec | SOV | 1.01% |
| 8.24% - 2027 G-Sec | SOV | 0.89% |
| 7.17% - 2028 G-Sec | SOV | 0.34% |
| Corporate Bond | 5.80% | |
| Kotak Mahindra Prime | AAA | 4.25% |
| Power Finance Corporation | AAA | 1.04% |
| NABARD | AAA | 0.51% |
| Net Cash and Cash Equivalent | 2.10% | |
| Grand Total | 100.00% | |
| oTop 10 Equity Holdings |
| Banks | 17.77% |
| IT - Software | 8.60% |
| Finance | 6.29% |
| Automobiles | 4.88% |
| Petroleum Products | 4.64% |
| Pharmaceuticals & Biotechnology | 4.29% |
| Diversified FMCG | 2.68% |
| Retailing | 2.41% |
| Consumer Durables | 2.31% |
| Electrical Equipment | 2.31% |
| Construction | 2.14% |
| Auto Components | 2.05% |
| Telecom - Services | 1.99% |
| Cement & Cement Products | 1.83% |
| Leisure Services | 1.64% |
| Textiles & Apparels | 1.48% |
| Insurance | 1.33% |
| Power | 1.05% |
| Gas | 1.05% |
| Oil | 0.93% |
| Fertilizers & Agrochemicals | 0.83% |
| Industrial Products | 0.83% |
| Food Products | 0.79% |
| Chemicals & Petrochemicals | 0.78% |
| Ferrous Metals | 0.71% |
| Entertainment | 0.66% |
| Personal Products | 0.62% |
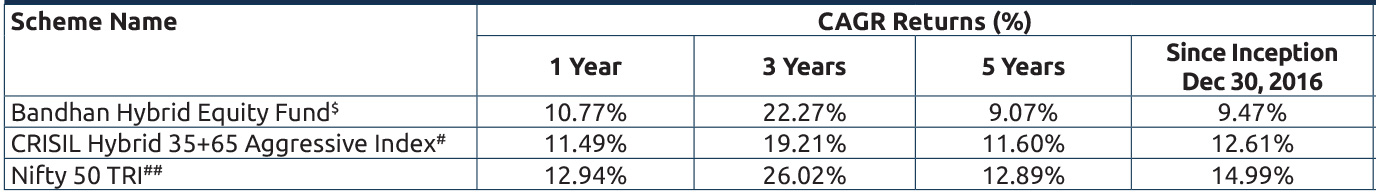
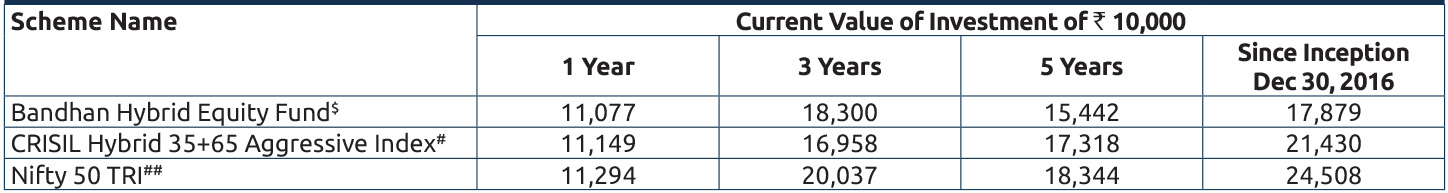
Performance based on NAV as on 31/05/2023. Past performance may or may not be sustained in future.
The performances given are of regular plan growth option.
Click here for other funds managed by the fund manager and refer to the respective fund pages
#Benchmark Returns. ##Alternate Benchmark Returns.
Scheme risk-o-meter
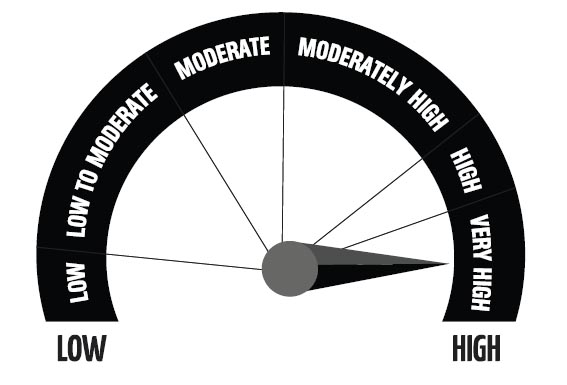
Investors understand that their principal will be at Very High risk
This product is suitable for investors who are seeking*
- To create wealth over long term.
- Investment predominantly in equity and equity related securities and balance exposure in debt and money market instruments.
* Investors should consult their financial advisers if in doubt about whether the product is suitable for them.
Benchmark risk-o-meter
CRISIL Hybrid 35+65 Aggressive Index
Regular and Direct Plans have different expense structure. Direct Plan shall have a lower expense ratio excluding distribution expenses, commission expenses etc.
*Risk-free rate assumed to be 6.40% (FBIL OVERNIGHT MIBOR as on 31st May 2023). Ratios calculated on the basis of 3 years history of monthly data.
^Portfolio Turnover ratio is calculated as Lower of purchase or sale during the period / Average AUM for the last one year (includes Fixed Income securities and Equity derivatives).
The portfolio shall be rebalanced on the first business day of every month.
$The fund has been repositioned from Balanced category to Aggressive Hybrid category w.e.f. April 30, 2018.
Dedicated fund manager for foreign / overseas investment has been changed from Mr. Viraj Kulkarni to Ms. Nishita Doshi (w.e.f. from 1st July 2022)
§With effect from 13th March 2023, the name of "IDFC Hybrid Equity Fund" has changed to "Bandhan Hybrid Equity Fund"
