Commentary

Commentary
|
|
|
|
|

|


How the global market has performed?
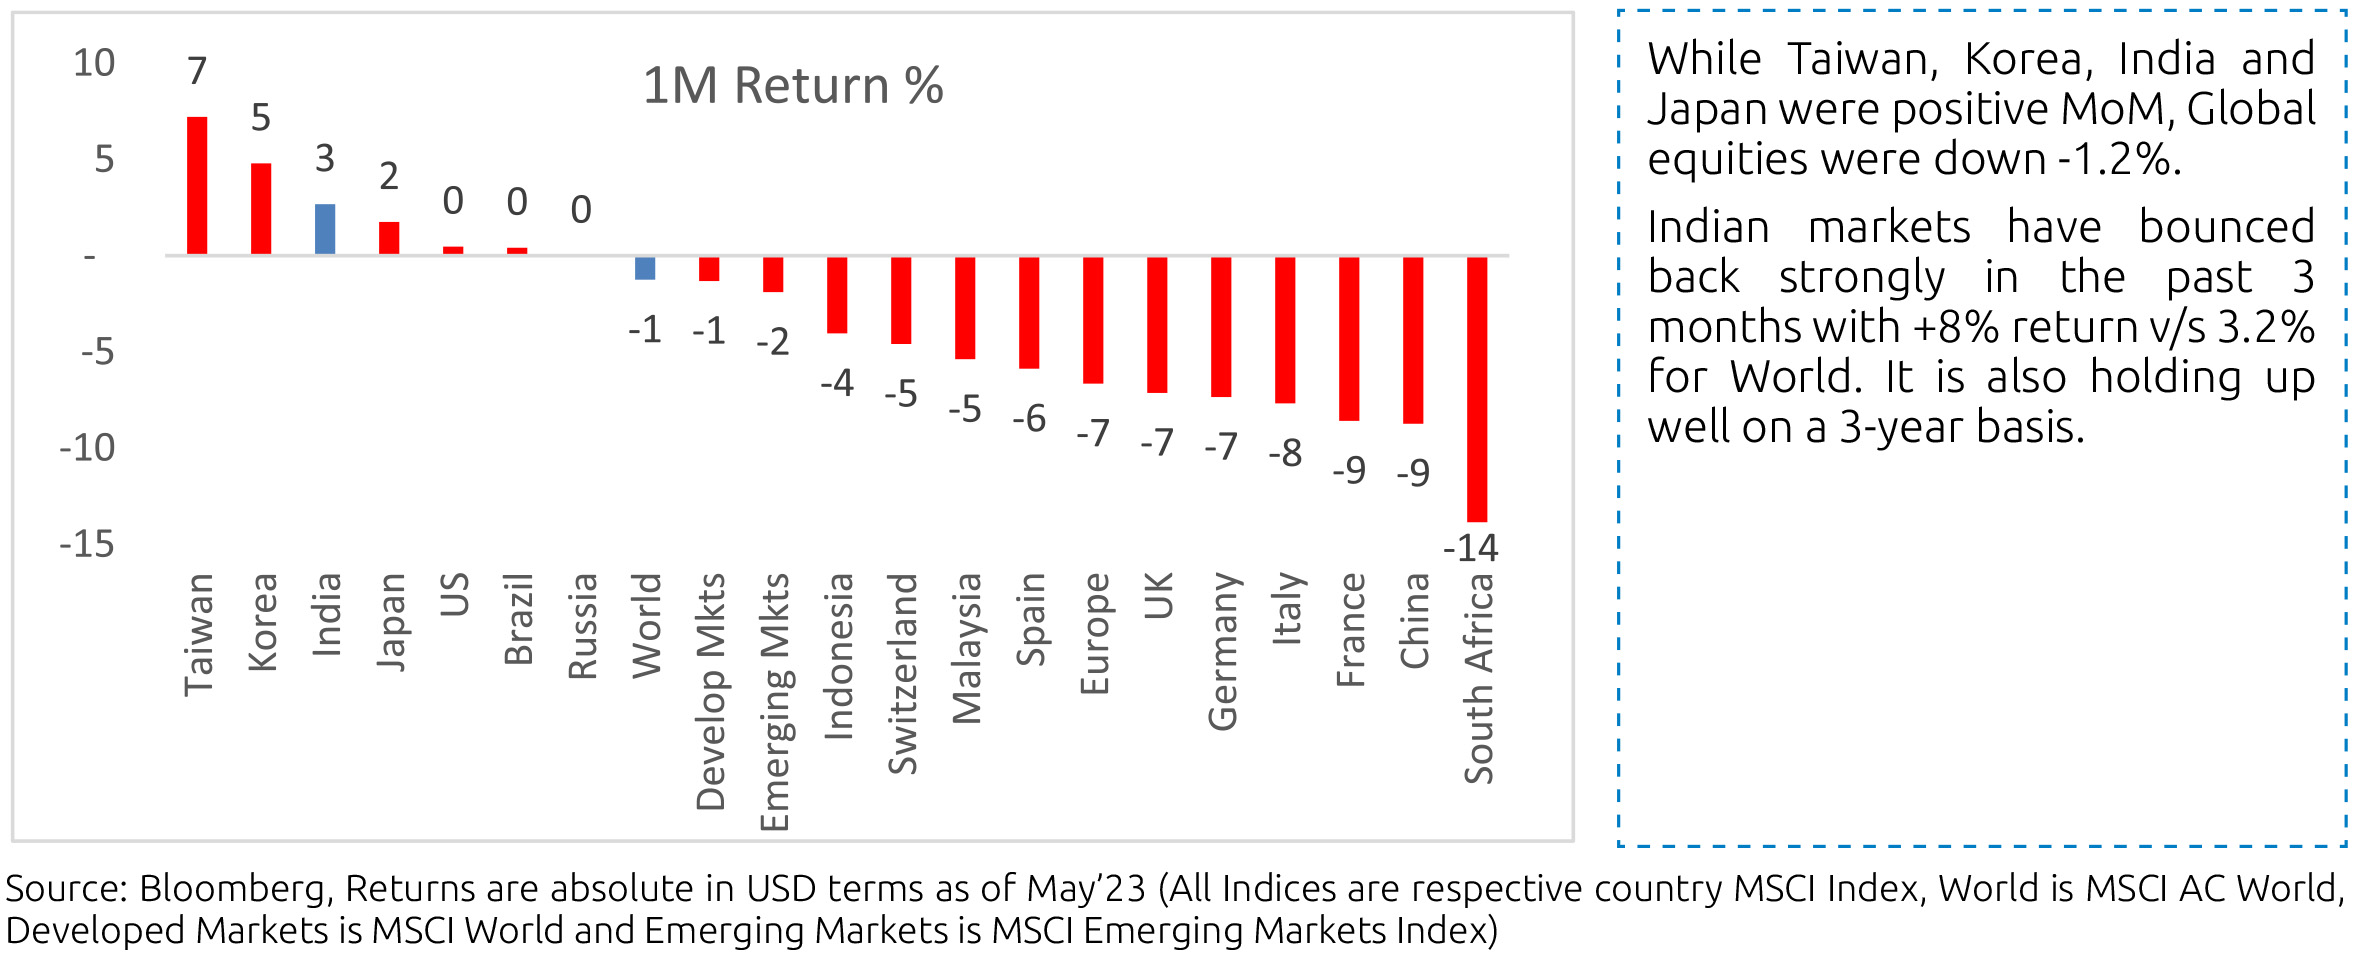
Comparative: In past 3months, India has bounced back strongly and is holding up well on a 3-year basis.
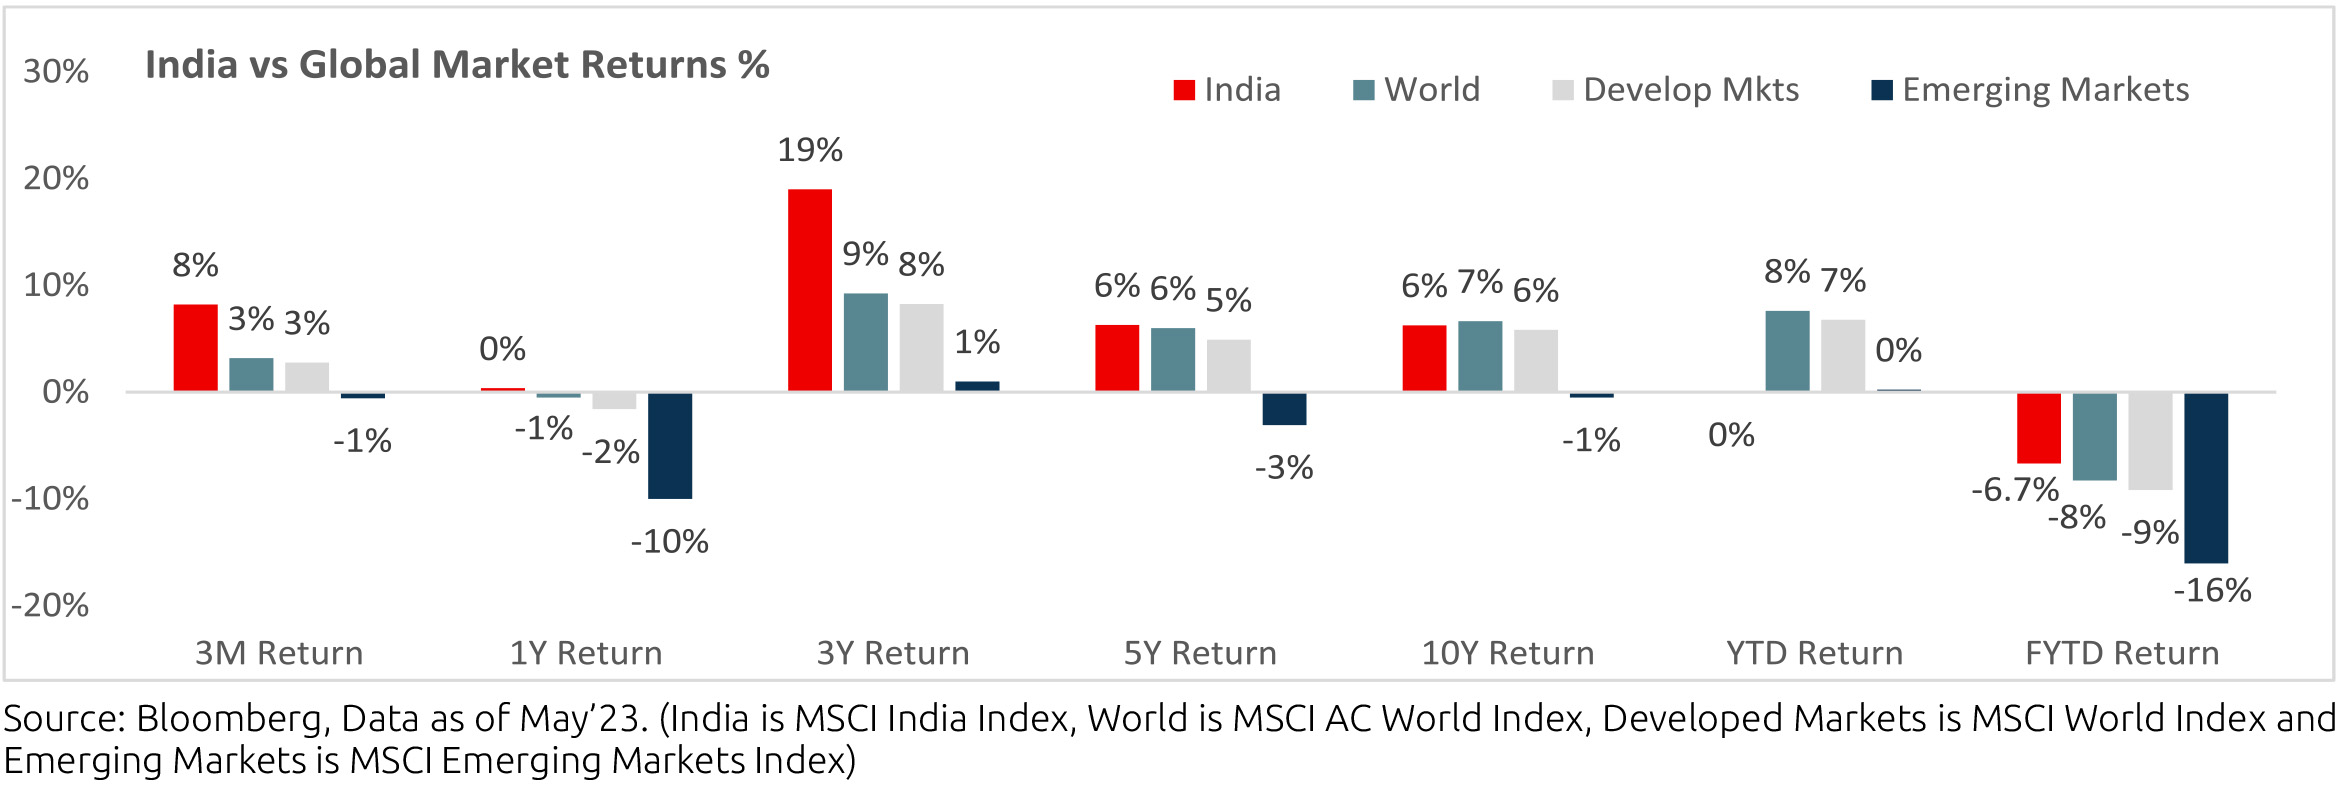
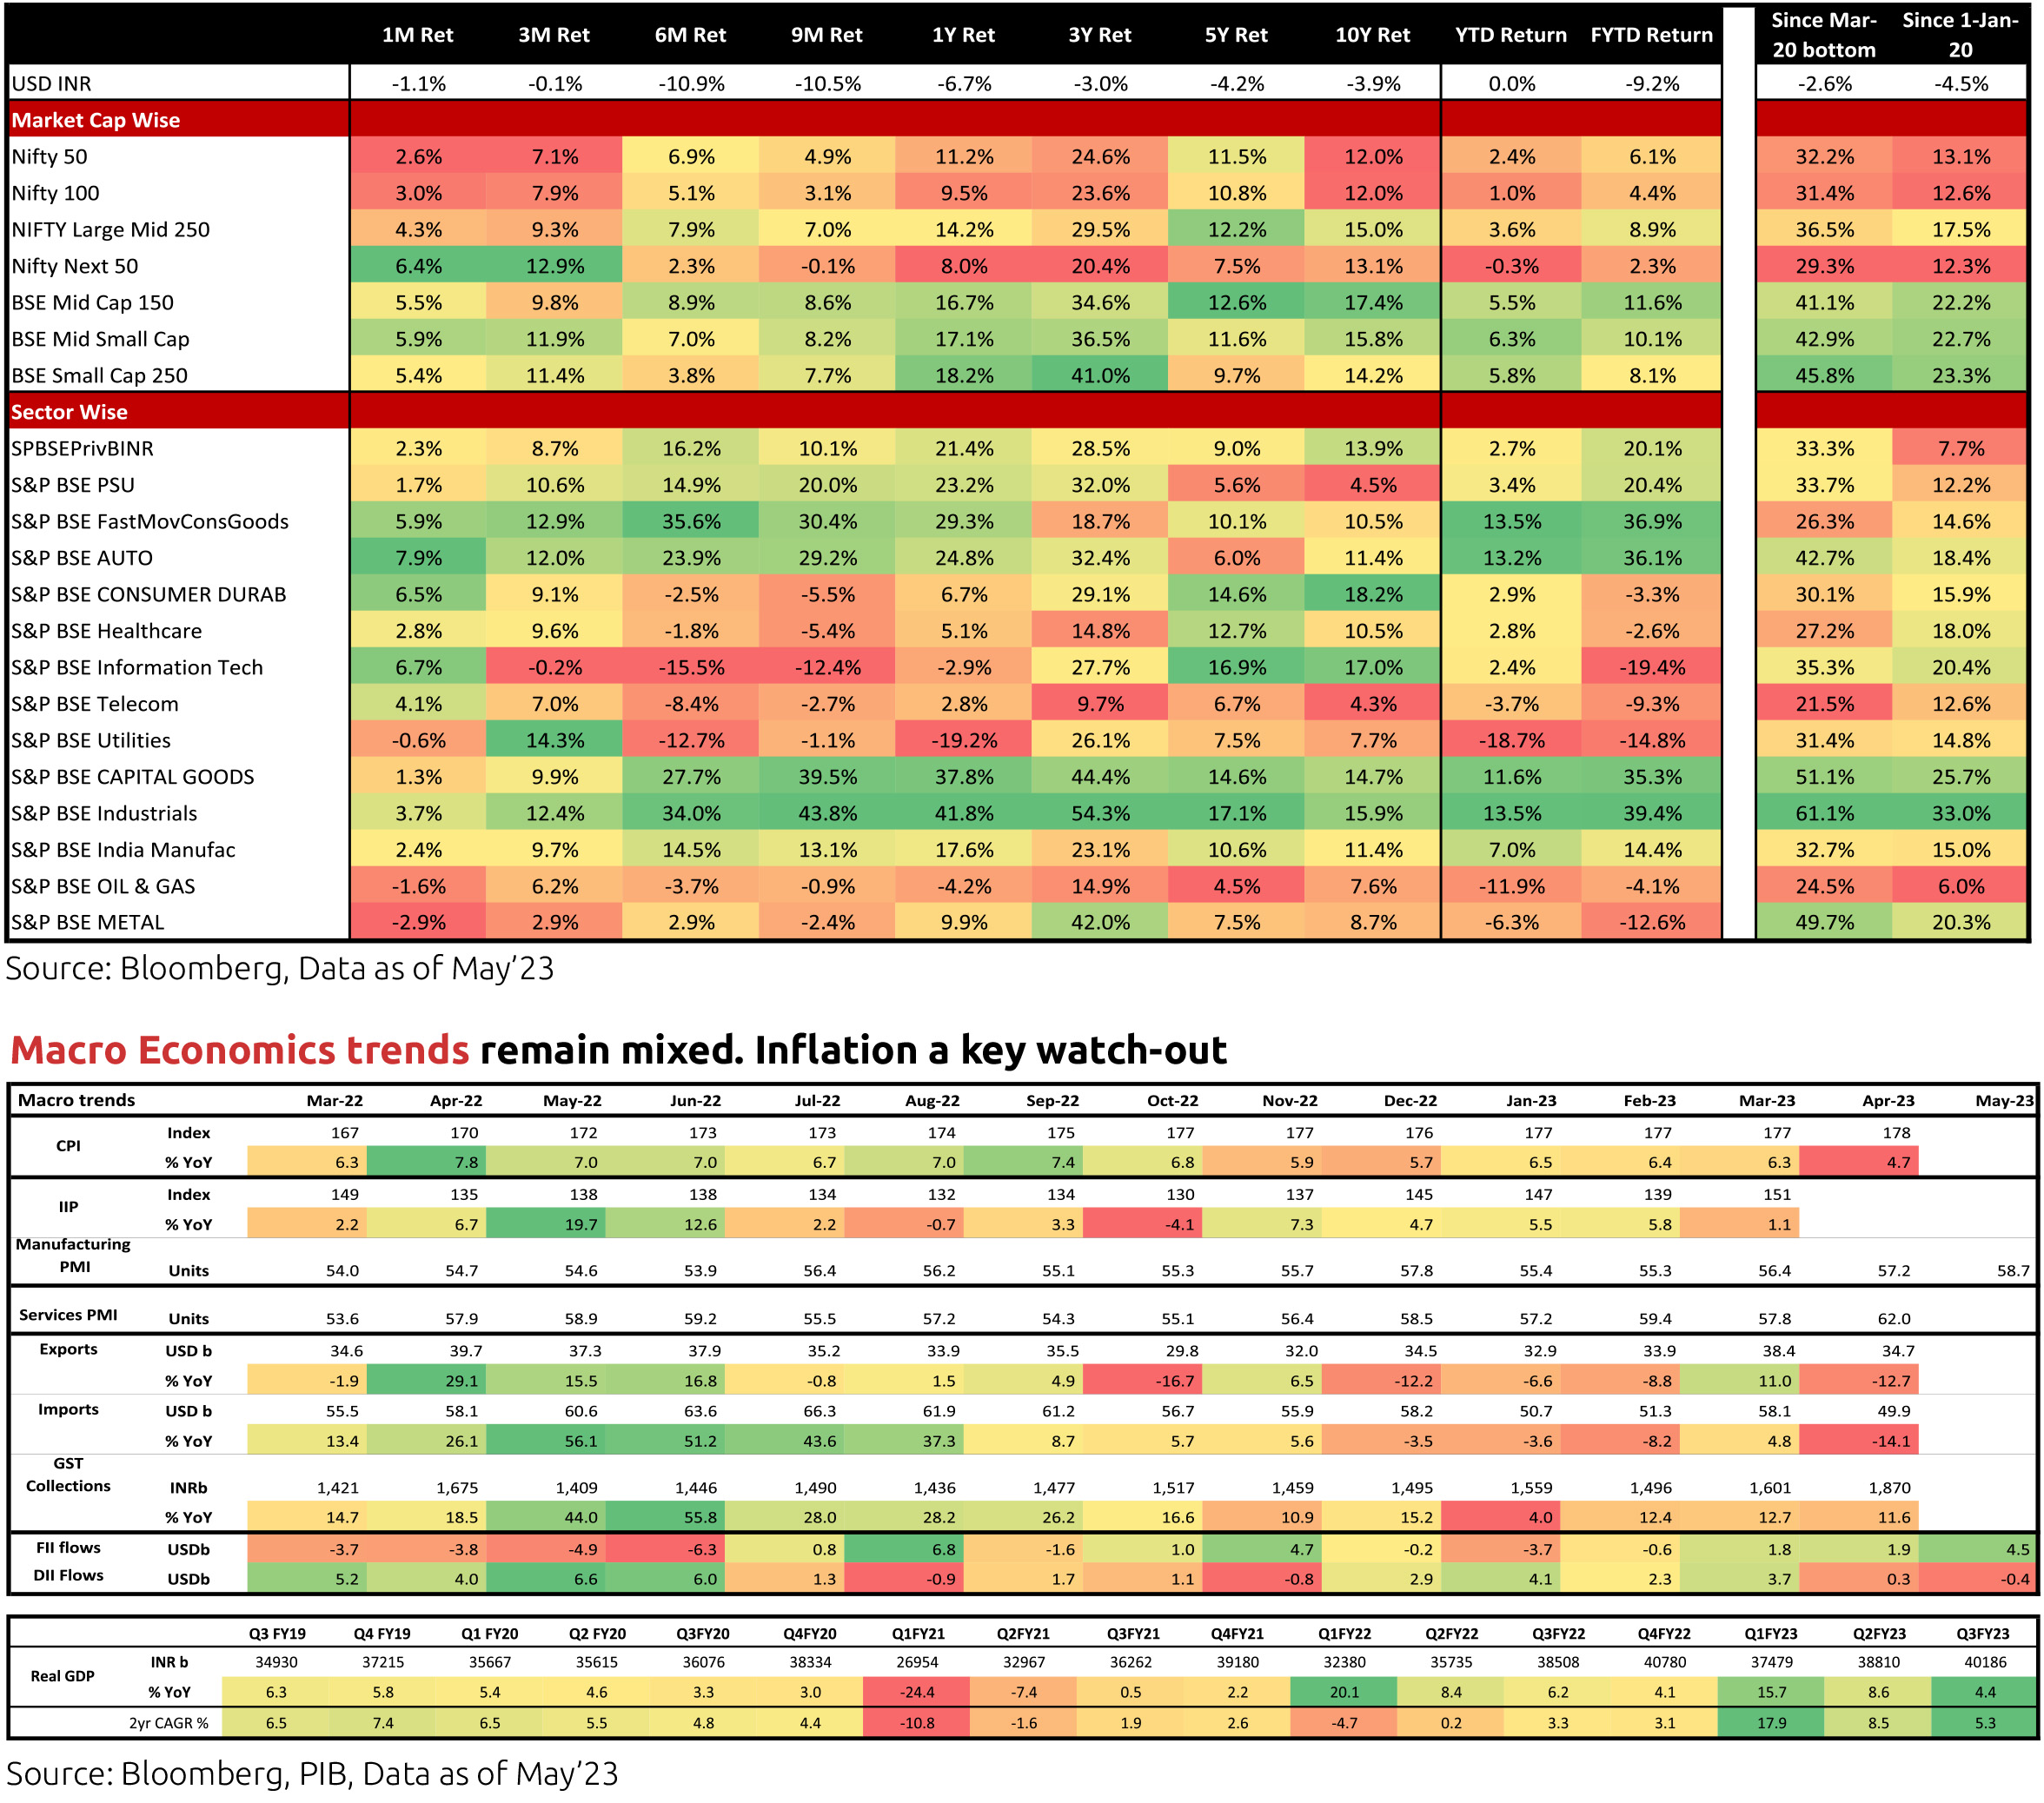
How the Indian Market has performed?
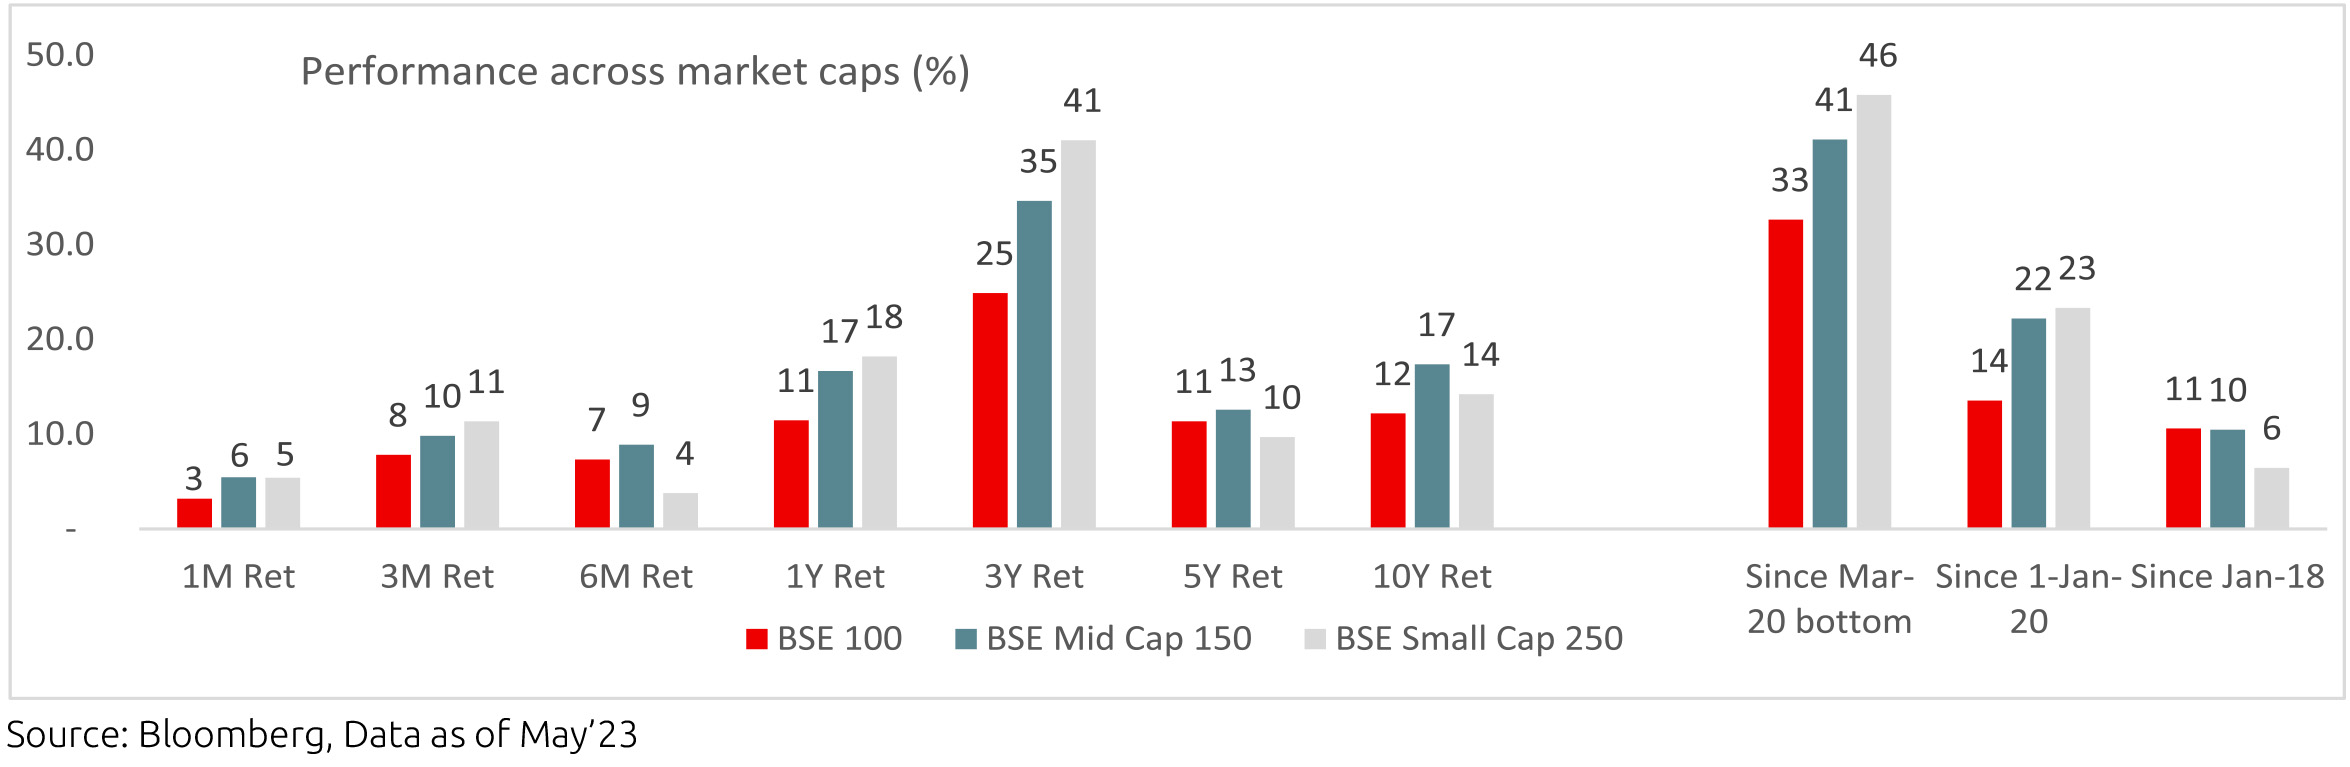
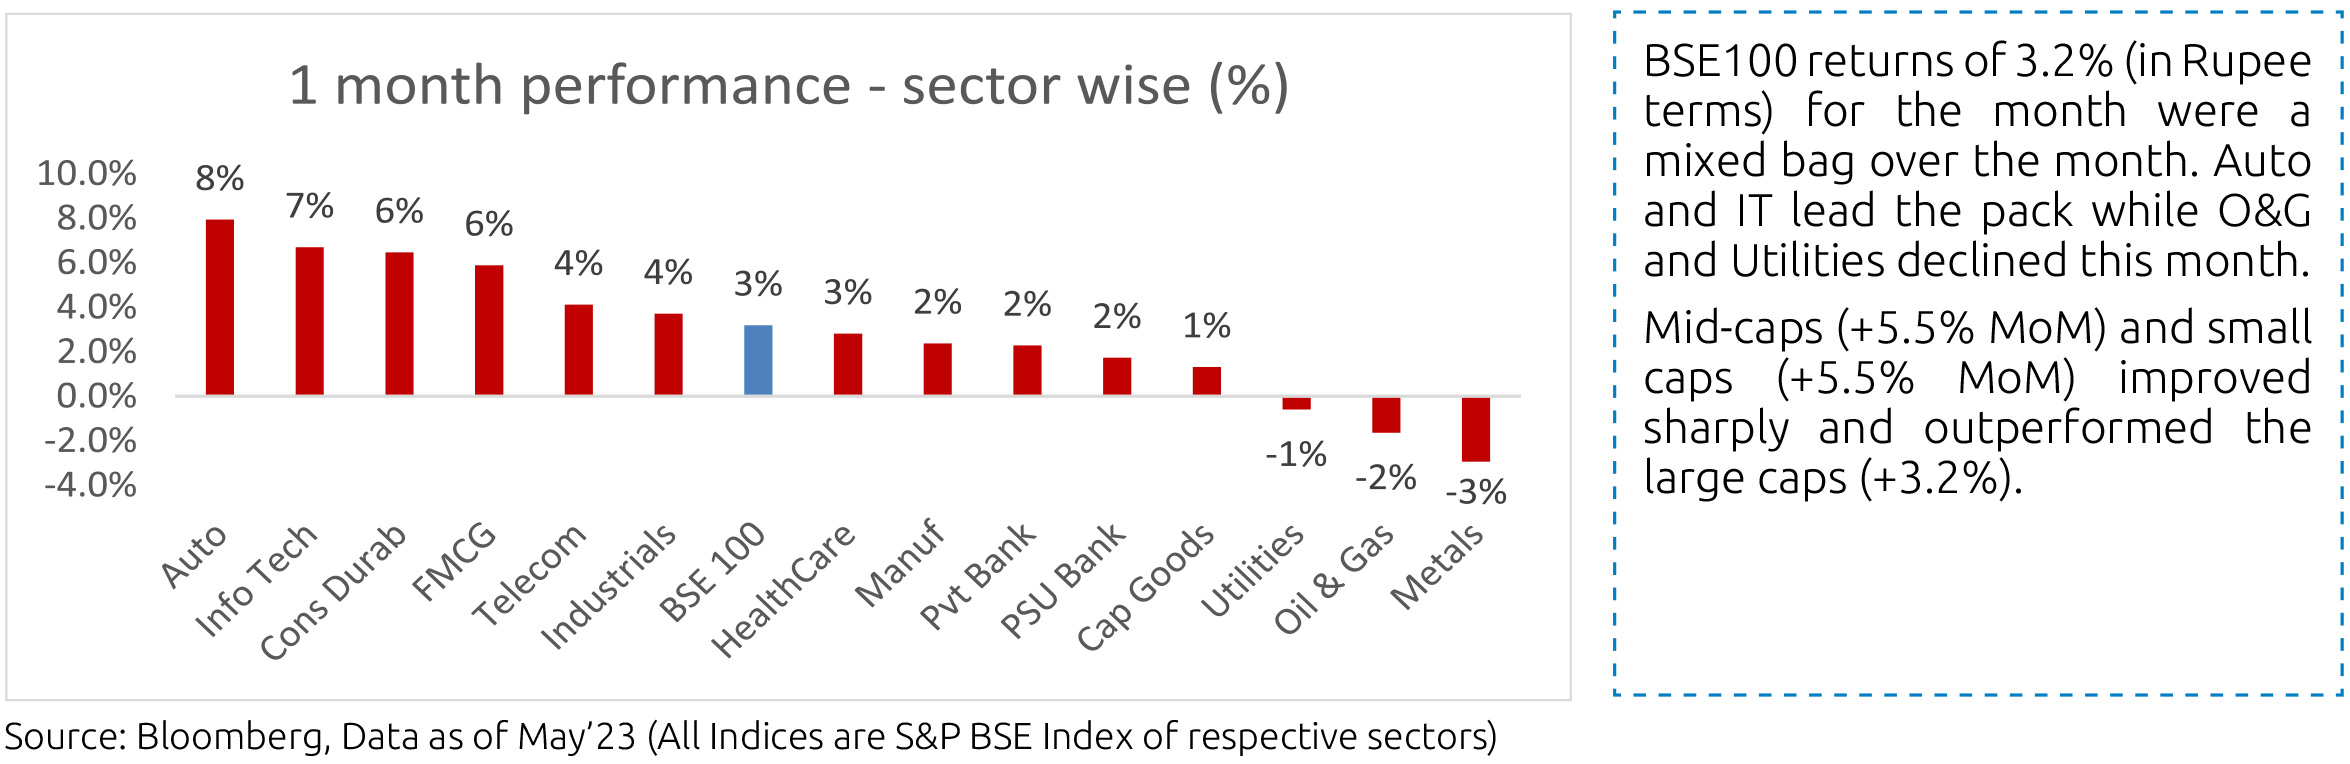
Market Performance
Equity Outlook
The Indian market has bounced back strongly in absolute terms and relative to emerging markets. Key reasons for this we believe are - the improving external accounts situation due to fall in energy prices and robust service exports which has made the currency outlook positive, continued economic momentum in India whereas many countries are slowing down and the disappointment on China growth where after the COVID restrictions going away, the economic rebound has disappointed. We believe these factors will continue to drive India's growth outperformance. Key risks going forward are - the monsoon outlook and state elections at the end of the year.
Note: The above graph is for representation purposes only and should not be used for the development or implementation of an investment strategy. Past performance may or may not be sustained in the future.
India's nominal GDP growth moderated to 10.4% y/y in the March quarter, from 11.4% in the December quarter, but real GDP
growth surprised to the upside at 6.1% after 4.5% in December. On a seasonally adjusted q/q basis, real GDP growth was 1.4%
after 1.7% in December. For the full year, nominal GDP growth was 16.1% in FY23 after 18.4% in FY22, while real GDP growth
was 7.2% (revised up from 7%) after 9.1%. Growth was driven by fixed investment, given the central government focus on capex,
and improving net exports. However, real private consumption growth remained modest at 2.8% y/y in the March quarter after
2.2% in the December quarter. On the supply side, growth in agriculture was strong while that in manufacturing turned positive
(on a real y/y basis) in the March quarter after two quarters of contraction. Real growth in services improved to 6.9% y/y in the
March quarter from 6.1% in the December quarter. Growth in real Core-GVA (GVA excluding Agriculture, forestry & fishing and
Public administration, defence & other services), on a y/y basis, eased for the full year but picked up in the March quarter.
Central government fiscal deficit for the full year FY23 ended marginally lower vs. revised estimates from the recent union budget. In FY23, net tax revenue growth was 16.2% y/y while total expenditure grew 10.4%. In April, overall tax collection stayed buoyant and capital expenditure was strong. In May, the central government also received a higher-than-budgeted dividend from RBI of Rs. 87,416cr (Rs. 30,307cr in May 2022). GST collection continued to remain robust at Rs. 1.57 lakh crore and 12% y/y in May.
Consumer Price Index (CPI) inflation in India was in line with expectation at 4.7% y/y in April after 5.7% in March. Food and beverages price momentum picked up further turned positive as prices of pulses, fruits, sugar and meat & fish increased while that of cereals (driven by wheat), egg and oils & fats fell sequentially. Vegetable price momentum stayed almost flat. Core inflation (CPI excluding food and beverages, fuel and light), which averaged 6% y/y in FY22 and 6.1% in FY23, moderated further to 5.2% in April from 5.8% in March, also due to base effects. Real time prices of pulses are continuing to rise while that of oils & fats are falling. Global agencies now assign a higher probability for an El Niño occurrence this year. El Niño is typically associated with lesser southwest monsoon rainfall in India, although not a given, and thus potentially lower agriculture production. Various factors impact monsoon season rainfall including other weather phenomenon like the India ocean Dipole. Ultimately, spatial and temporal distribution of rainfall and government supply side measures matter for agriculture production and food inflation.
Industrial production (IP) growth was 1.1% y/y in March after 5.8% in February. On a seasonally adjusted month-on-month basis, it was -1.3% in March after +0.5% in February. By category, output momentum turned negative for primary, infrastructure & construction and consumer non-durable goods. Infrastructure Industries output (40% weight in IP) grew 1.9% m/m (seasonally adjusted) in April after being negative in February and March.
Bank credit outstanding as on 19th May was up 15.4% y/y, moderating from late October 2022 and has averaged 15.8% so far in calendar year 2023. Bank deposit growth was at 10.9% and has averaged 10.3% so far in 2023. Credit flow in FY23 was much higher than in the previous two financial years with strong flows to personal loans (39% of total flow) and services (37% of total flow).
Merchandise trade deficit for April moderated to USD 15.2bn from USD 18.6bn in March. In April, oil exports were down by USD 1.8bn and non-oil exports were down by USD 4.9bn. However, oil imports were down by USD 2.8bn and non-oil-non-gold imports by USD 5bn. Trade deficit had picked up from September 2021 and averaged USD 21.4bn till September 2022 (vs. USD 10.8bn during April-August 2021) when non-oil-non-gold imports picked up to an average of USD 38.8bn (vs. USD 29.4bn). However, it is now well off the recent high of USD 28bn in September 2022. Services trade surplus has continued to surprise to the upside in recent months with an average monthly surplus of USD 13.4bn since October 2022 (after USD 10.4bn in H1 FY23).
Among higher-frequency variables, number of two-wheelers registered picked up sharply from October (also festive season effect), eased strongly thereafter but has improved more recently. Energy consumption levels picked up from mid-March to mid-April and then fell till end of April but has picked up again now and is currently near previous year levels. Monthly number of GST e-way bills generated picked up to 9.1cr units in March (year-end effect also) and was at 8.8cr in May. It averaged 8.5cr in the March quarter and 8.6cr in April-May.
US headline CPI was at 4.9% y/y in April, after 5% in March, although the negative price momentum in energy goods reversed as momentum in other categories stayed moderate. By category, momentum in food and beverages, medical care and education & communication stayed benign while that in transport (used cars and trucks) and recreation picked up. Rental price momentum increased mildly from March but was still well below the growth seen until recent months. Overall, momentum in services and non-housing-core-services moderated mildly in April while that in core-goods increased. Core CPI was at 5.5% in April after 5.6% in March. US non-farm payroll addition in May (339,000 persons) was well above expectation and higher than in April (294,000 persons). However, unemployment rate increased to 3.7% in May from 3.4% in April (based on the household survey), Employment-Population ratio inched down and Labour Force Participation Rate stayed flat. Further, sequential growth in average hourly earnings moderated to 0.3% in May after it had increased to 0.4% in April. Non-farm job openings as per the Job Openings and Labor Turnover Survey (JOLTS) unexpectedly increased by 0.4mn to 10.1mn in April after falling for three months from the recent high of 11.2mn in December.
In response to the banking sector issues in the US from March this year, the Fed responded by introducing a new Bank Term Funding Program (apart from its standing discount window) to provide liquidity to banks and other eligible depository institutions to help meet the demand for its deposits. It also enabled takeover of small and regional banks which failed since then. In terms of data, deposit outflows from banks, particularly small banks, has stabilised. The FOMC (Federal Open Market Committee) raised the target range for the federal funds rate by 25 bps on 03rd May, a total of 500bps since 2022 to the 5.00-5.25% range. However, the statement was changed to suggest future policy rate increases are not a given and that the committee will follow a data-dependant approach to determine the extent to which additional policy firming may be appropriate. The Fed Governor in his interaction after the FOMC meeting said the economy is likely to face further headwinds from tighter credit conditions, which were already tightening to rate actions and softer economic outlook. He also said the Committee currently has a view inflation coming down will take some time and if that is right, it will not cut rates (vs. rate cuts in 2023 expected by the markets).
The European Central Bank's Governing (ECB) Council in its monetary policy decision in May raised all the three key interest rates by 25bps, a total of 375bps so far in this cycle, and said it expects to discontinue the reinvestments under the Asset Purchase Programme as of July 2023. It said underlying price pressures remain strong, past increases are being transmitted (although lags and strength of transmission are uncertain) and that it will follow a data-dependent approach to determine the appropriate level and duration of restriction. However, in the press conference, the ECB President said some governors wanted a 50bps hike this meeting and it is very clear the Council is not pausing here, based on the current baseline projections from March. In the June 2023 monetary policy review, the MPC kept rates and stance unchanged, the latter with the expected dissent from Prof. Varma. While the rate inaction was expected by almost everyone, there was some debate on whether a more qualified stance may now be forthcoming. In the event, the characterization on the stance landed somewhat more hawkish than what may have been expected.
Outlook
Given that liquidity conditions are likely to remain healthy over the next few months (FX seems benign and currency in circulation is in reverse, mostly from INR 2000 denomination notes coming back but also owing to seasonality), inflation will likely be above the 4% target during this period, and risks flagged are for second half of the year, this does suggest that the bar for a stance change is somewhat high for the next policy. And if that is true then it is hard to expect a rate cut in the very next policy after that. Thus the first 'window' for a rate cut now looks to be in December. However, a common 'frustration' with bond markets almost globally has been the resilience of growth from start of this year. Thus global growth turned out to be much stronger over calendar Q1 than was earlier expected. The same has been seen in India and, as the Governor notes, this seems to be continuing over the current quarter as well. Absent a significant global deflationary event (Eg: an adverse new financial market development of the order of the earlier US regional bank issue), it is unlikely that growth suddenly faces a 'road runner' moment and falls off; especially in an Indian context where there is genuine domestic resilience from improved balance sheets (unlike the West which was fueled by very large pandemic stimuli). That be the case, RBI / MPC may have the time to be patient before contemplating any modest rate cuts.
However, the above analysis doesn't mean negative things for the bond market. The fundamental premise for bond investments is to make carry income adjusted for various risks taken (credit, liquidity, and duration). The biggest challenge to this premise in turn occurs from unmanageable volatility. This was the biggest problem over the past year: volatility was large enough for a long time for risk adjusted carry income not to get realized. However, since then a lot has changed: Most of global rate hikes are behind us, the commodity price shock and supply congestions have largely unwound. Equally importantly, India's CPI and current account dynamics have improved substantially. In our view, this is largely because as external shocks have passed inflation dynamics are now being driven in individual countries by their respective policy responses in the period post the pandemic striking. As an example, US had an aggressive fiscal response which is still driving its local inflation dynamics. India's response was much more measured and hence this factor isn't in play here. Accordingly, inflation is largely responding to the passing of the global shock.
All of this means that Indian bond market volatility is now likely to be very much in a manageable zone. This has already been in play for the past few months when significant movements in US treasury yields are no longer influencing Indian yields to the extent they used to last year. Thus it is likely that the probability of earning carry from bonds is now much stronger than what was the case last year. But this is not enough. We need to answer allied questions as well: If carry is the game then isn't credit the name? Not necessarily. Apart from fundamental reasons to always have a quality book in fixed income (even if one is doing credit on the margin through satellite funds) there are very strong cyclical reasons to take into account. While concurrently the world is doing well, this is still in context of unacceptably high developed market (DM) inflation. Thus we aren't anywhere close to an equilibrium or resolution. Further the lagged impact of this aggressive DM hiking cycle is yet to play out fully. Not just that, the ability of DM central banks to respond to future crises (the famed Fed 'put') is now considerably weaker given the inflation episode that they are being subjected to now. Finally, the starting point today is for most credit market pricing to be quite benign given that the underlying narrative itself currently is quite benign.
In summary adding pro-cyclical risk makes the most sense when the timing is towards the end of a 'bust' cycle or if the pricing has cushion to accommodate that scenario or if you are reasonably sure that you are so far away from the scenario that it doesn't realistically matter. Market pricing on credit risk seems to reflect the third of these today and so far this view has been right, given that growth has held up better than what was generally feared (hoped for?). This is unlikely to be the case, however, given the disequilibrium referred to above. While there is one probabilistic scenario where there is orderly disinflation in the West which then leads to a loosening of financial conditions in a methodical manner, there are other scenarios where this cycle resolves in a much less benign fashion. Asset allocations cannot be built on one probable scenario only while ignoring others especially when pricing for risk isn't particularly attractive as well. As spreads widen over the course of the next few quarters and / or the narrative clarifies itself, credit can then be selectively added in satellite allocations.
One last area to address: if risk adjusted carry is the game, then why not focus on the very front end alone? We still prefer medium duration (3-6 year maturities) because re-investment risk will likely need addressing sometime down the line. In our view, and for reasons mentioned above, we are at a 'mature' part of the global cycle and this is likely to be followed by some monetary easing likely next year. Medium duration bonds allow for plugging likely reinvestment risks without inviting excessive volatility on account of duration risk. This view can be revisited or reaffirmed at some point in the future when the path is clearer.
