Commentary

Global Markets
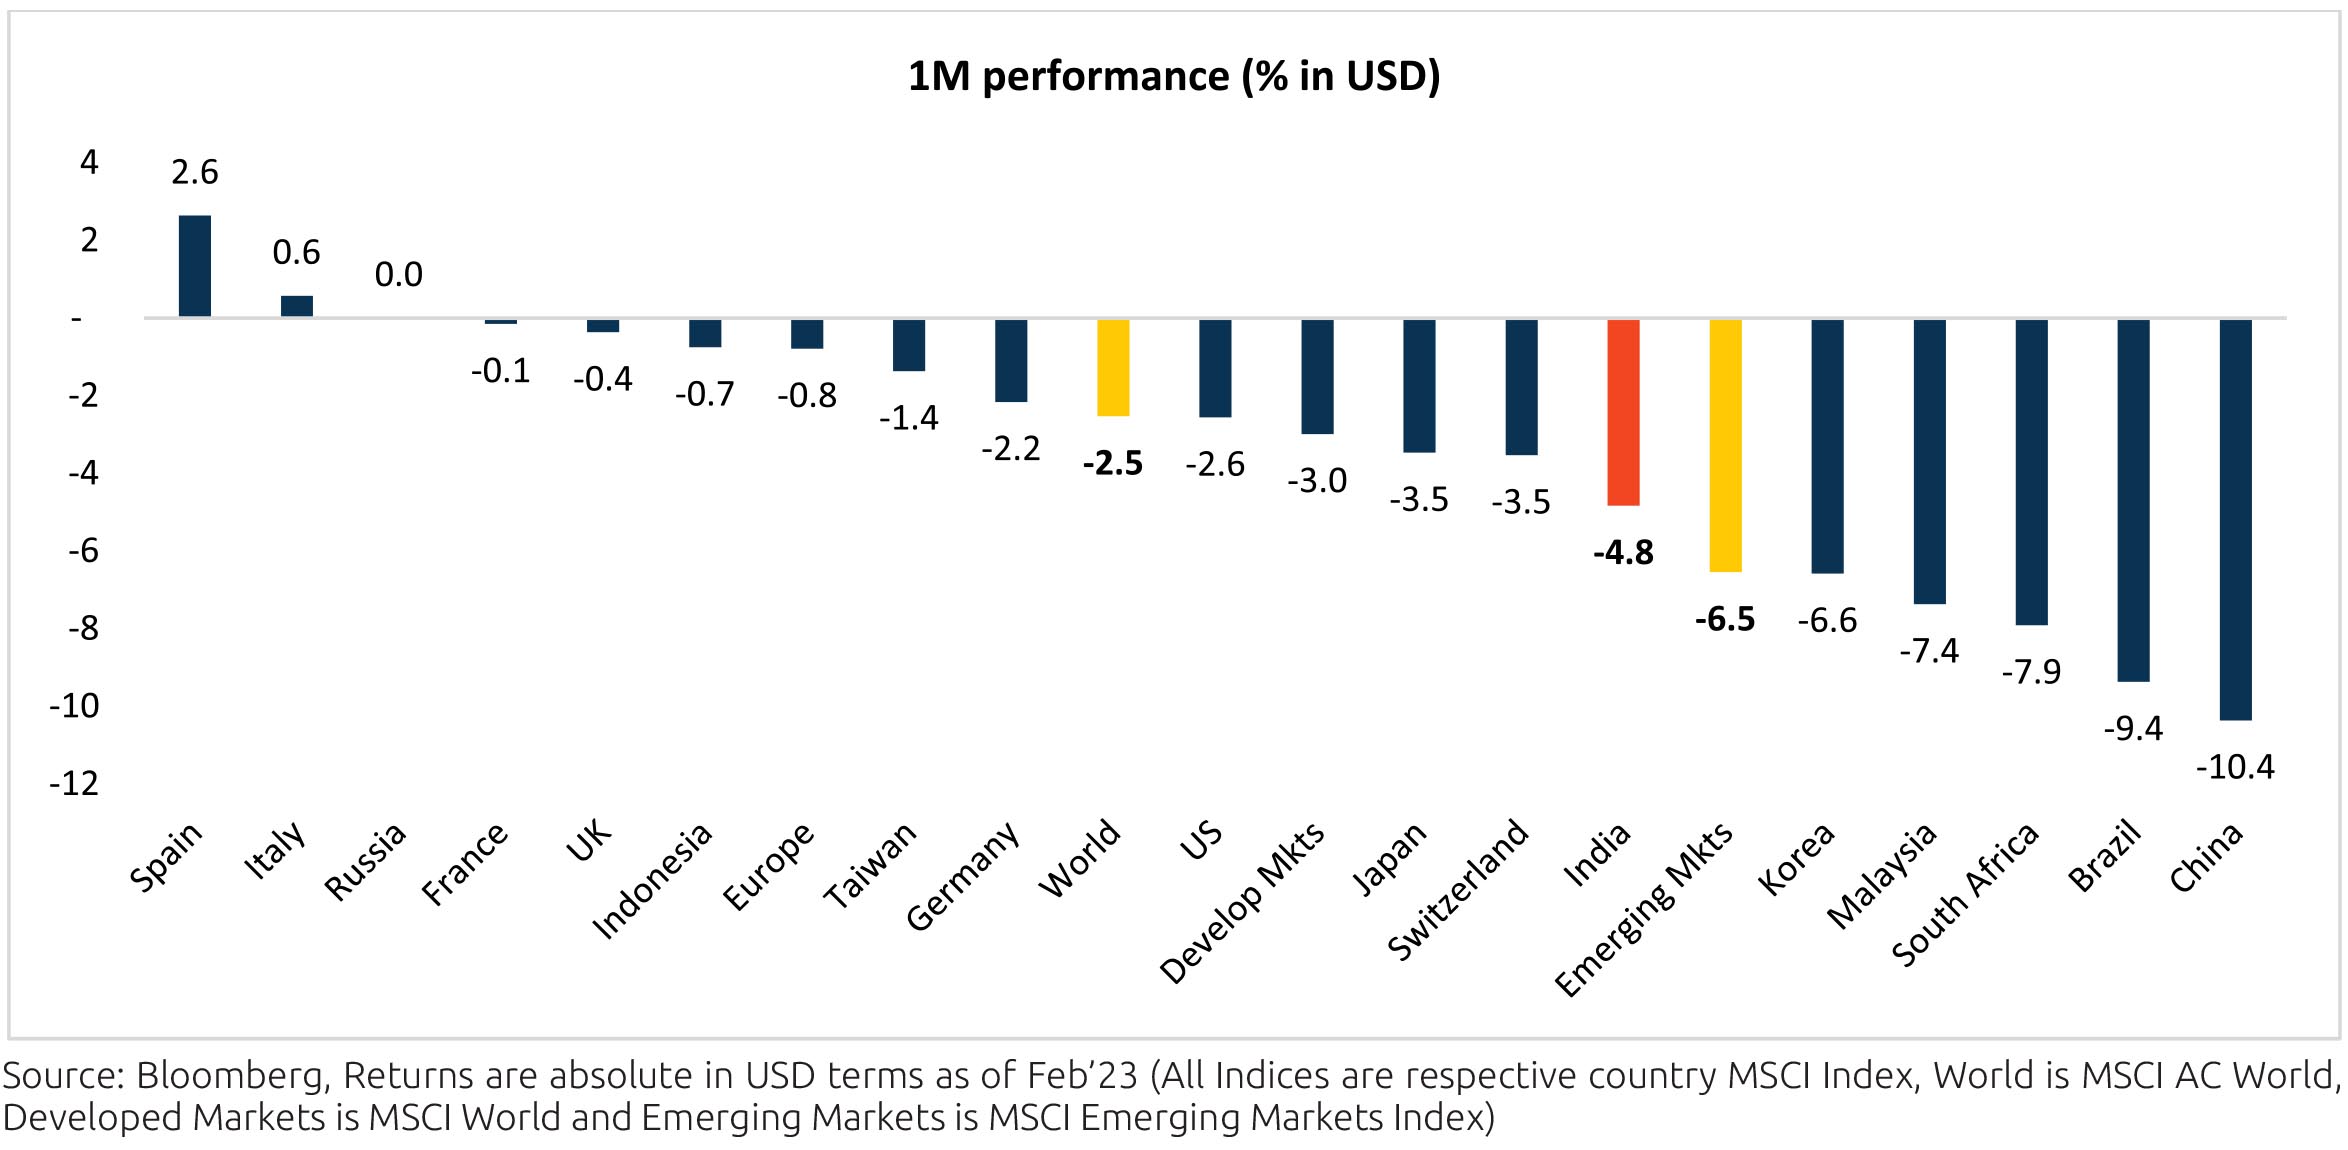
Global equities remained weak across countries (MSCI AC World -2.5% MoM with Spain and Italy being the only
outliers with positive returns. India declined by -4.8% MoM while Emerging markets were down -6.5% MoM largely
led by China (-10.4% MoM). Euro area held on with flattish (-0.8% MoM) returns.
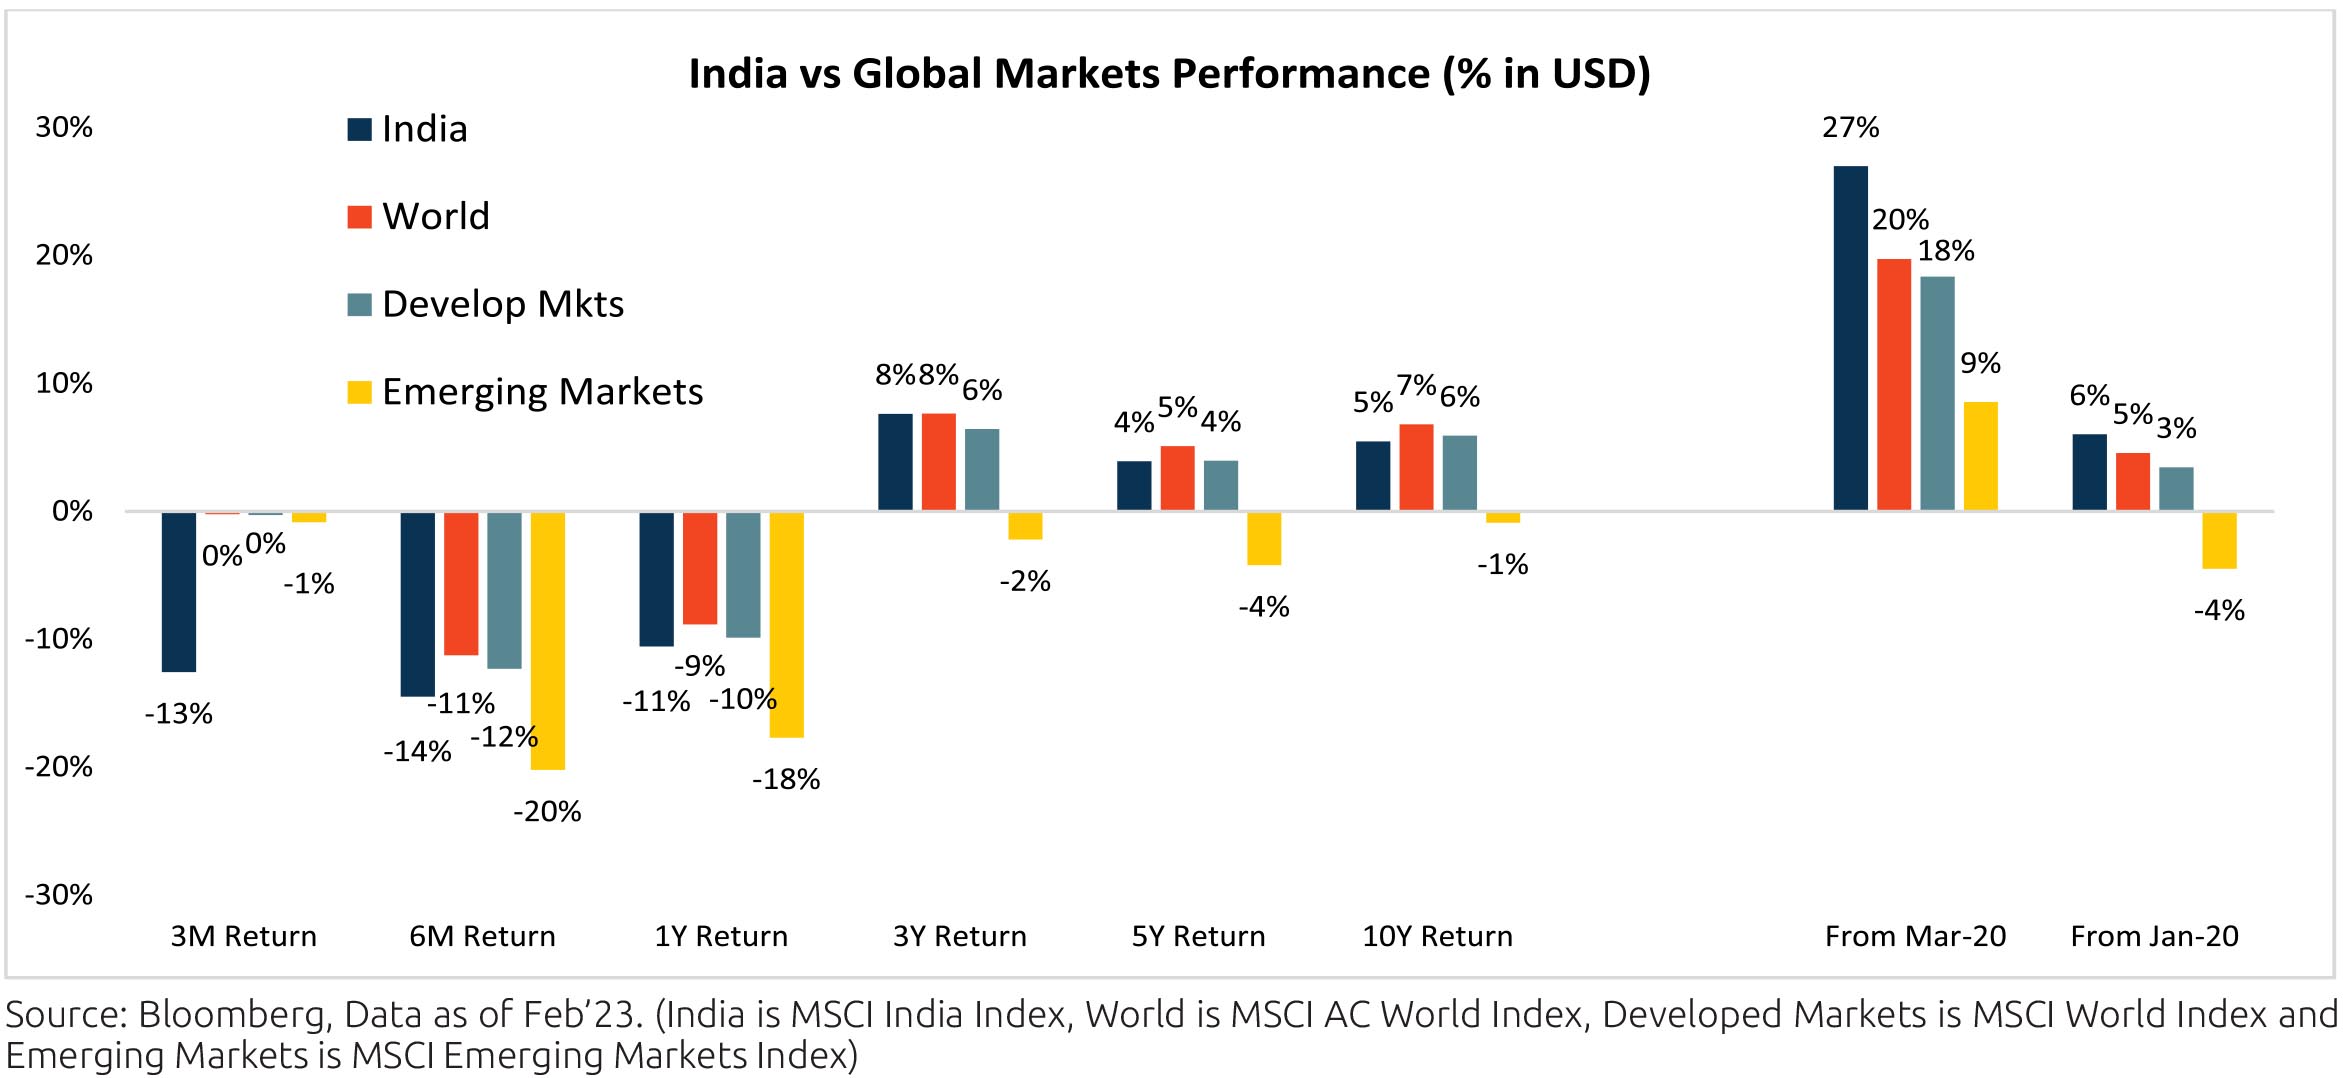
Indian equities has corrected sharply on a YTD basis ($ terms, -7.6% YTD) compared to the World ($ terms, 4.3% YTD) and Emerging countries ($ terms, 0.8% YTD) which are holding their which are still in positive.
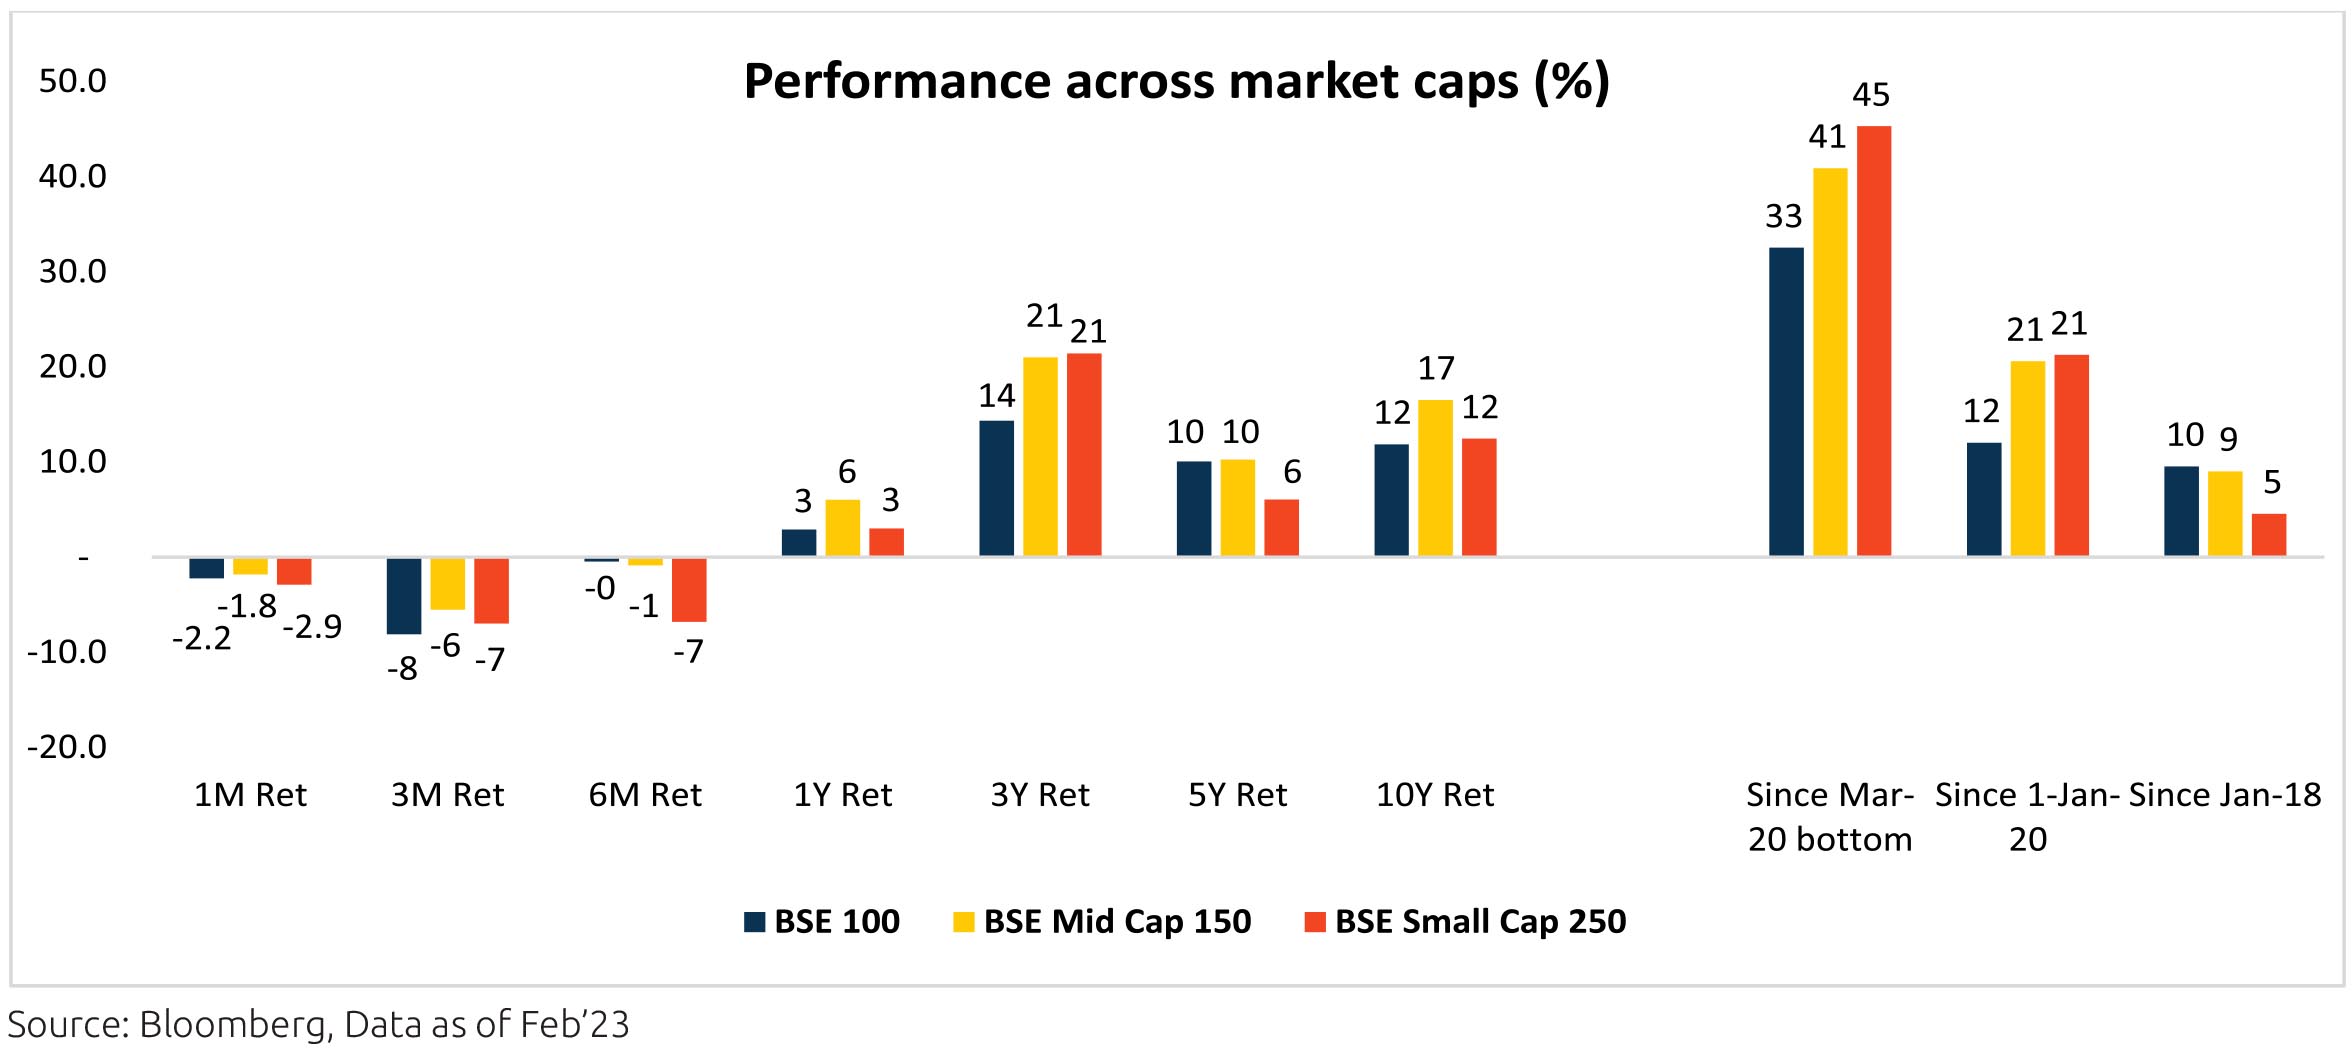
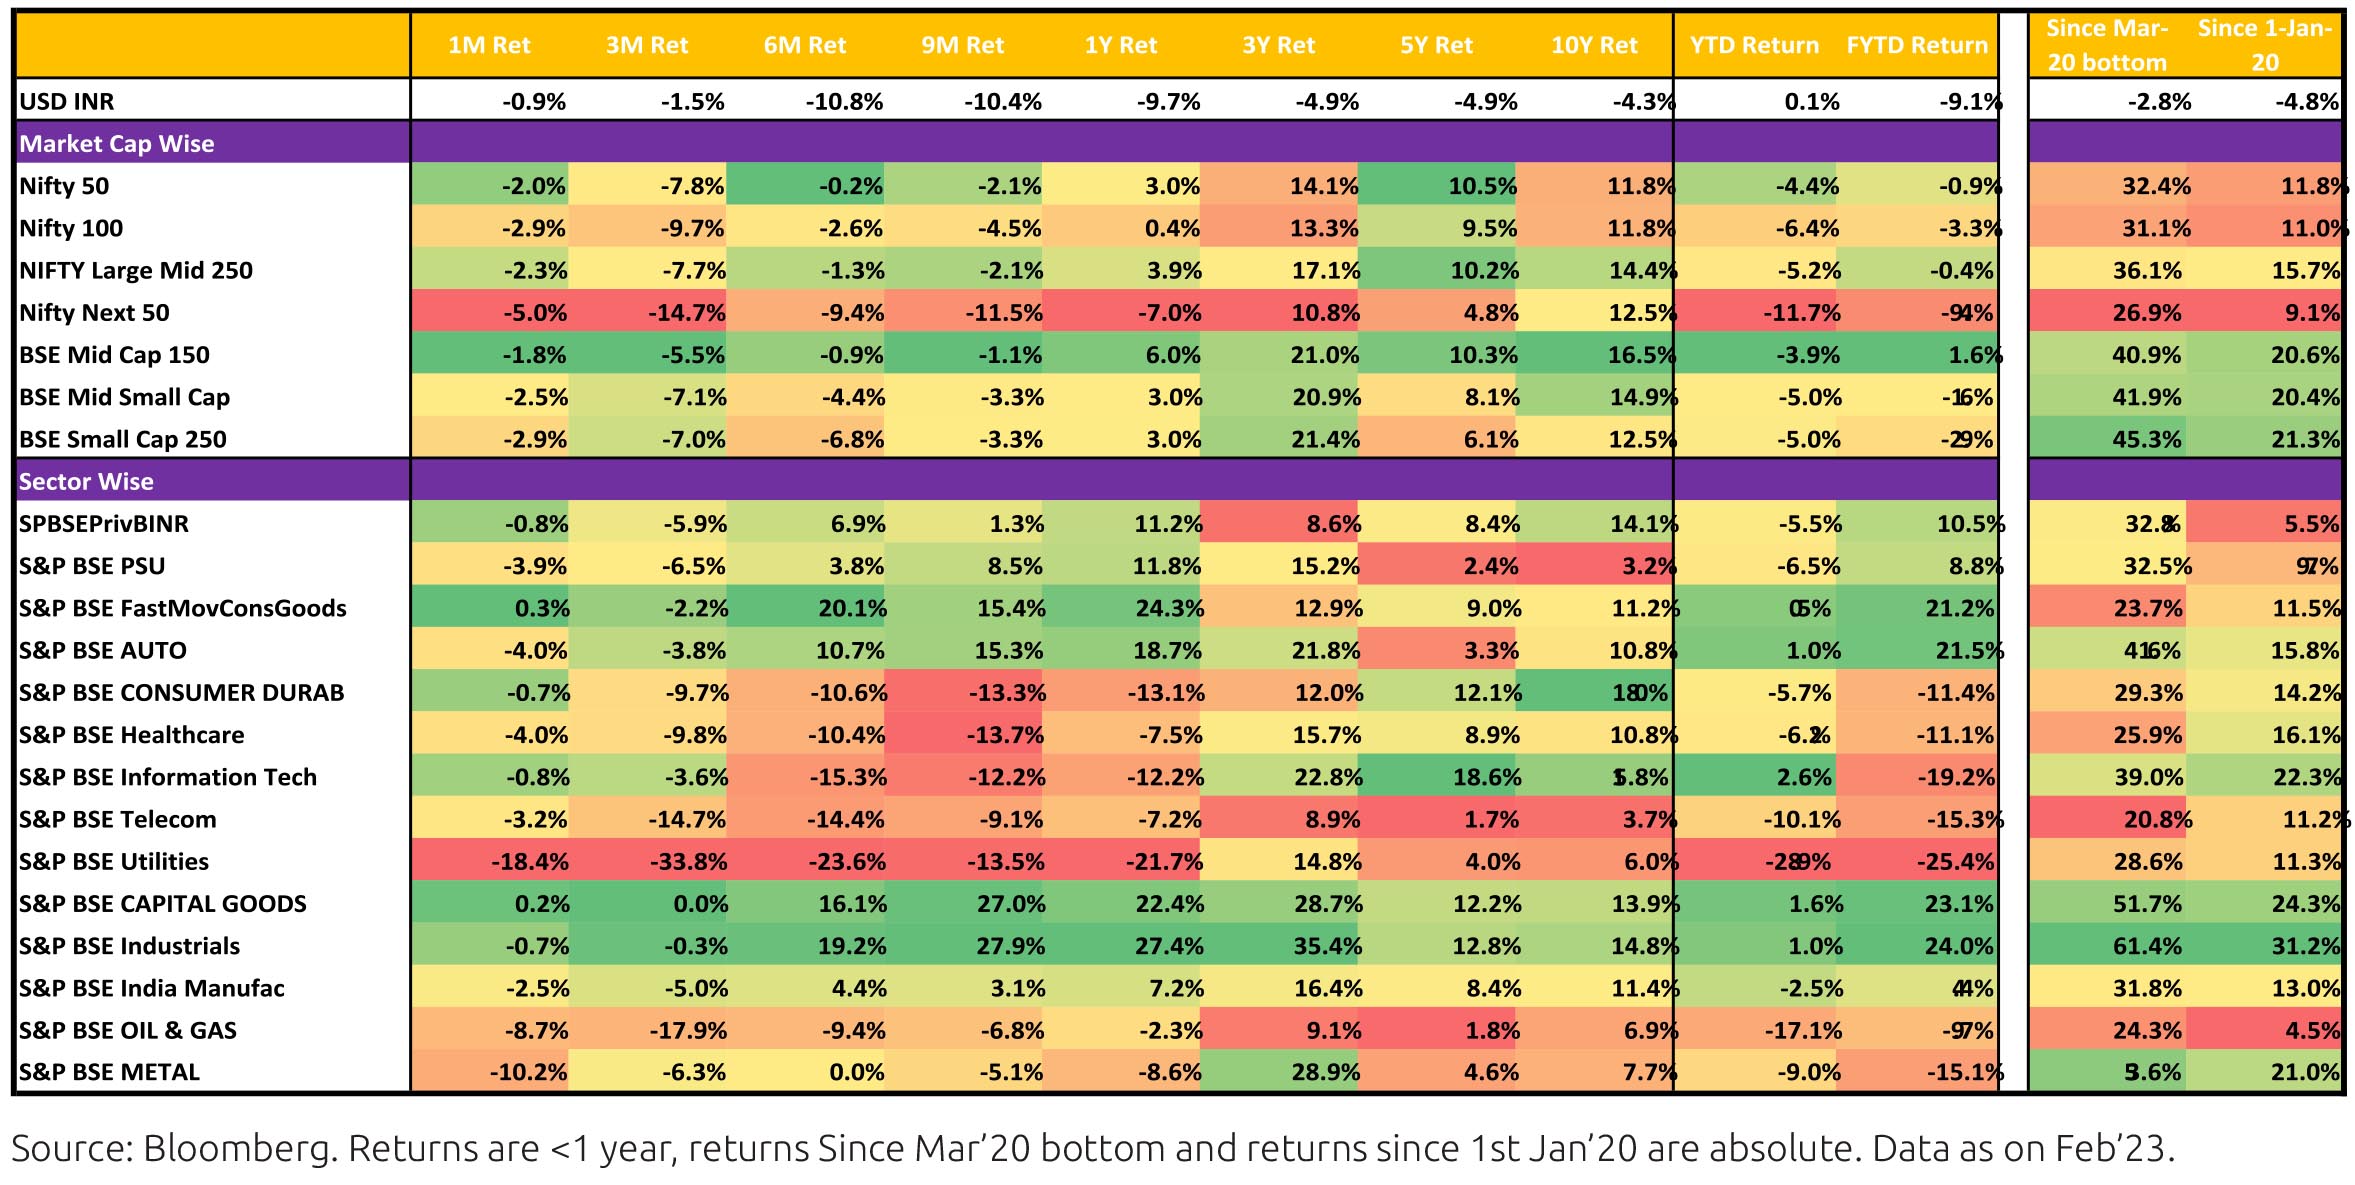
There has been a decline in MoM returns across market caps with Mid-caps (-1.8% MoM) performing slightly better
than small caps (-2.9% MoM) and large caps (-2.2% MoM).
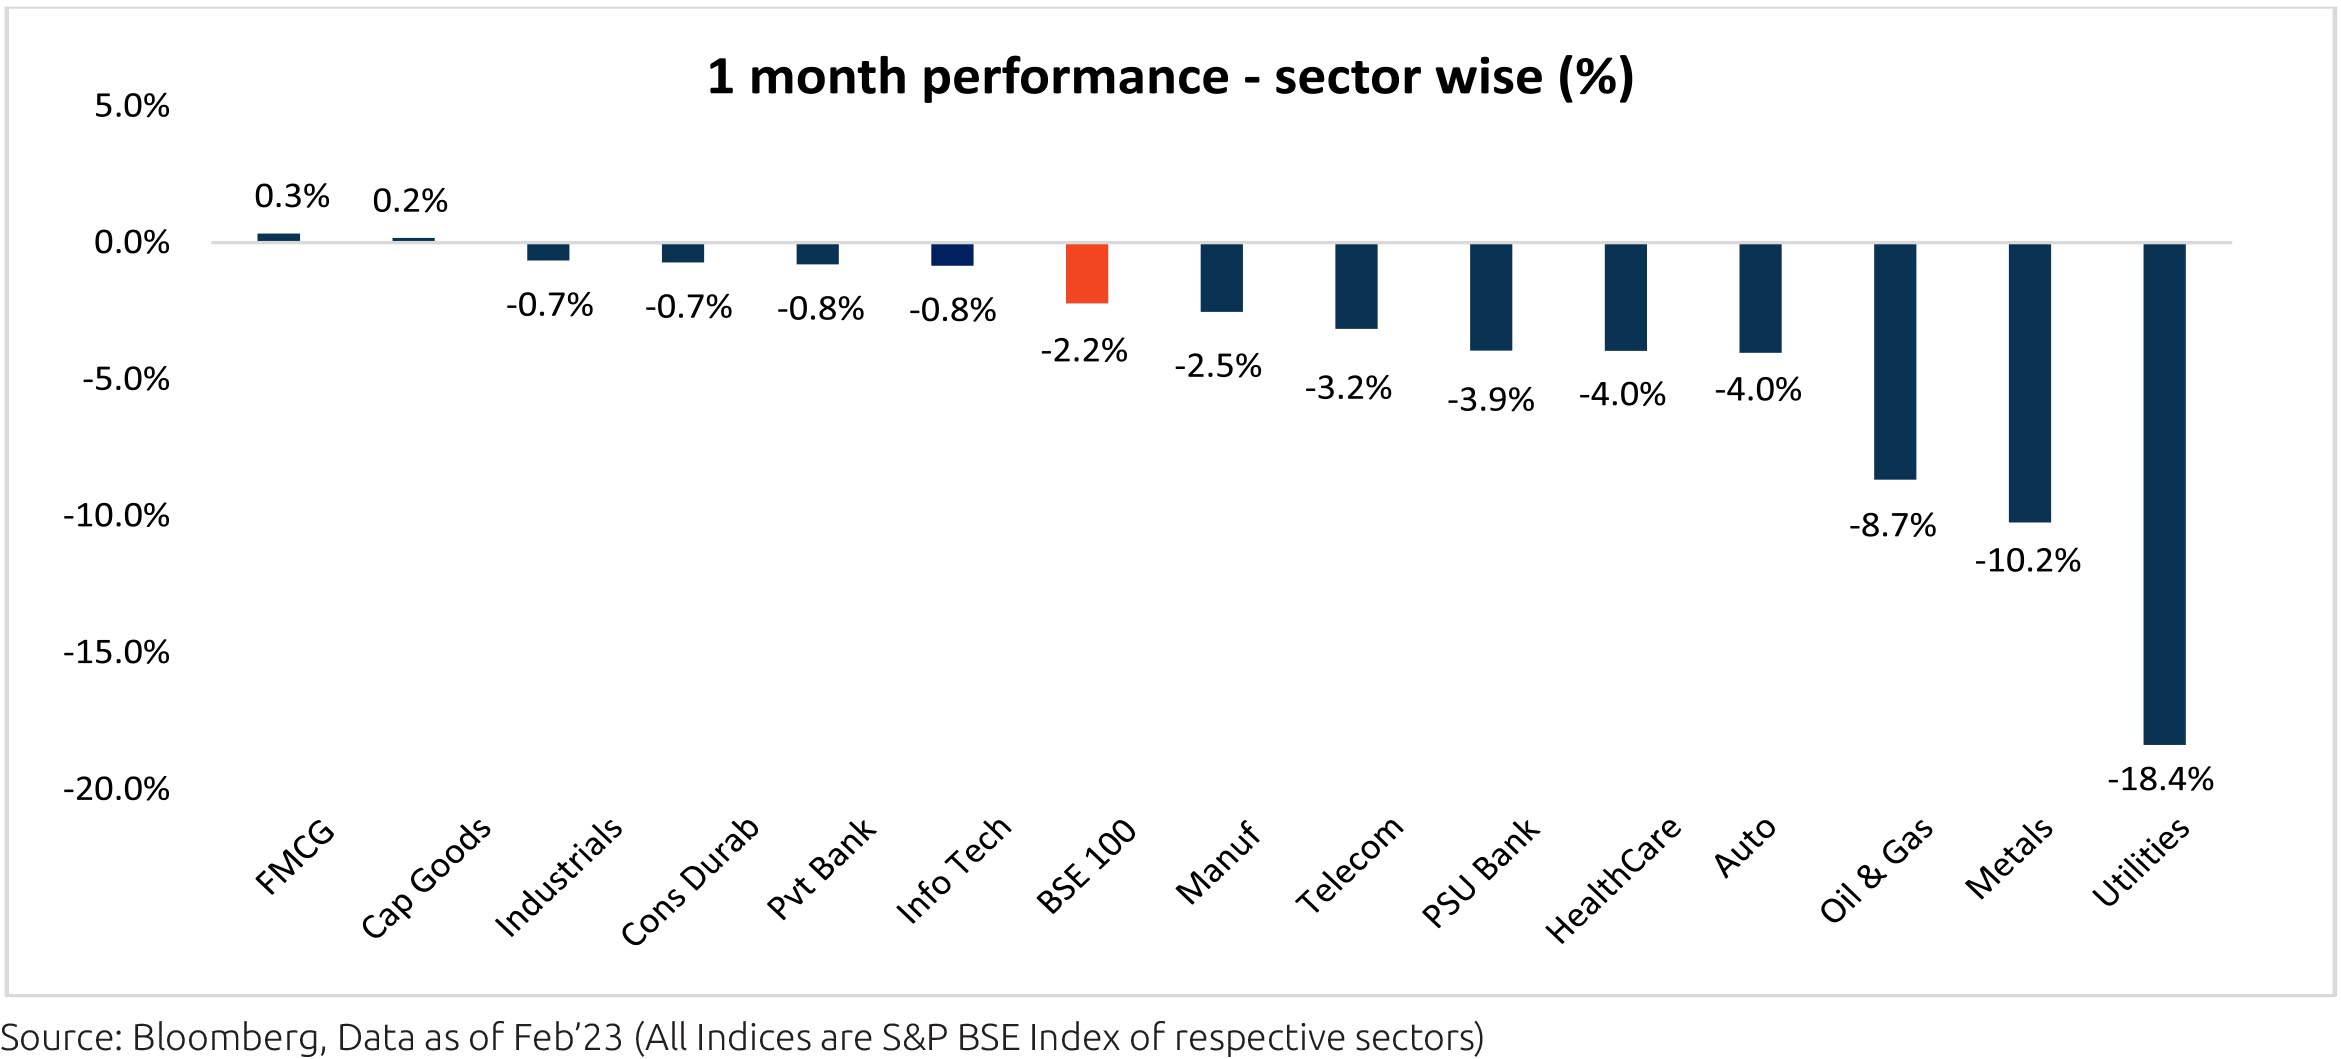
Sector performance was a mixed bag as NIFTY ended the month declining -2.2% MoM. Most of the sectors were in red barring FMCG and Capital goods sector which have remained flatish. Oil & gas, Metals and Utilities sector were the key drags for the month.
Macro Economics:
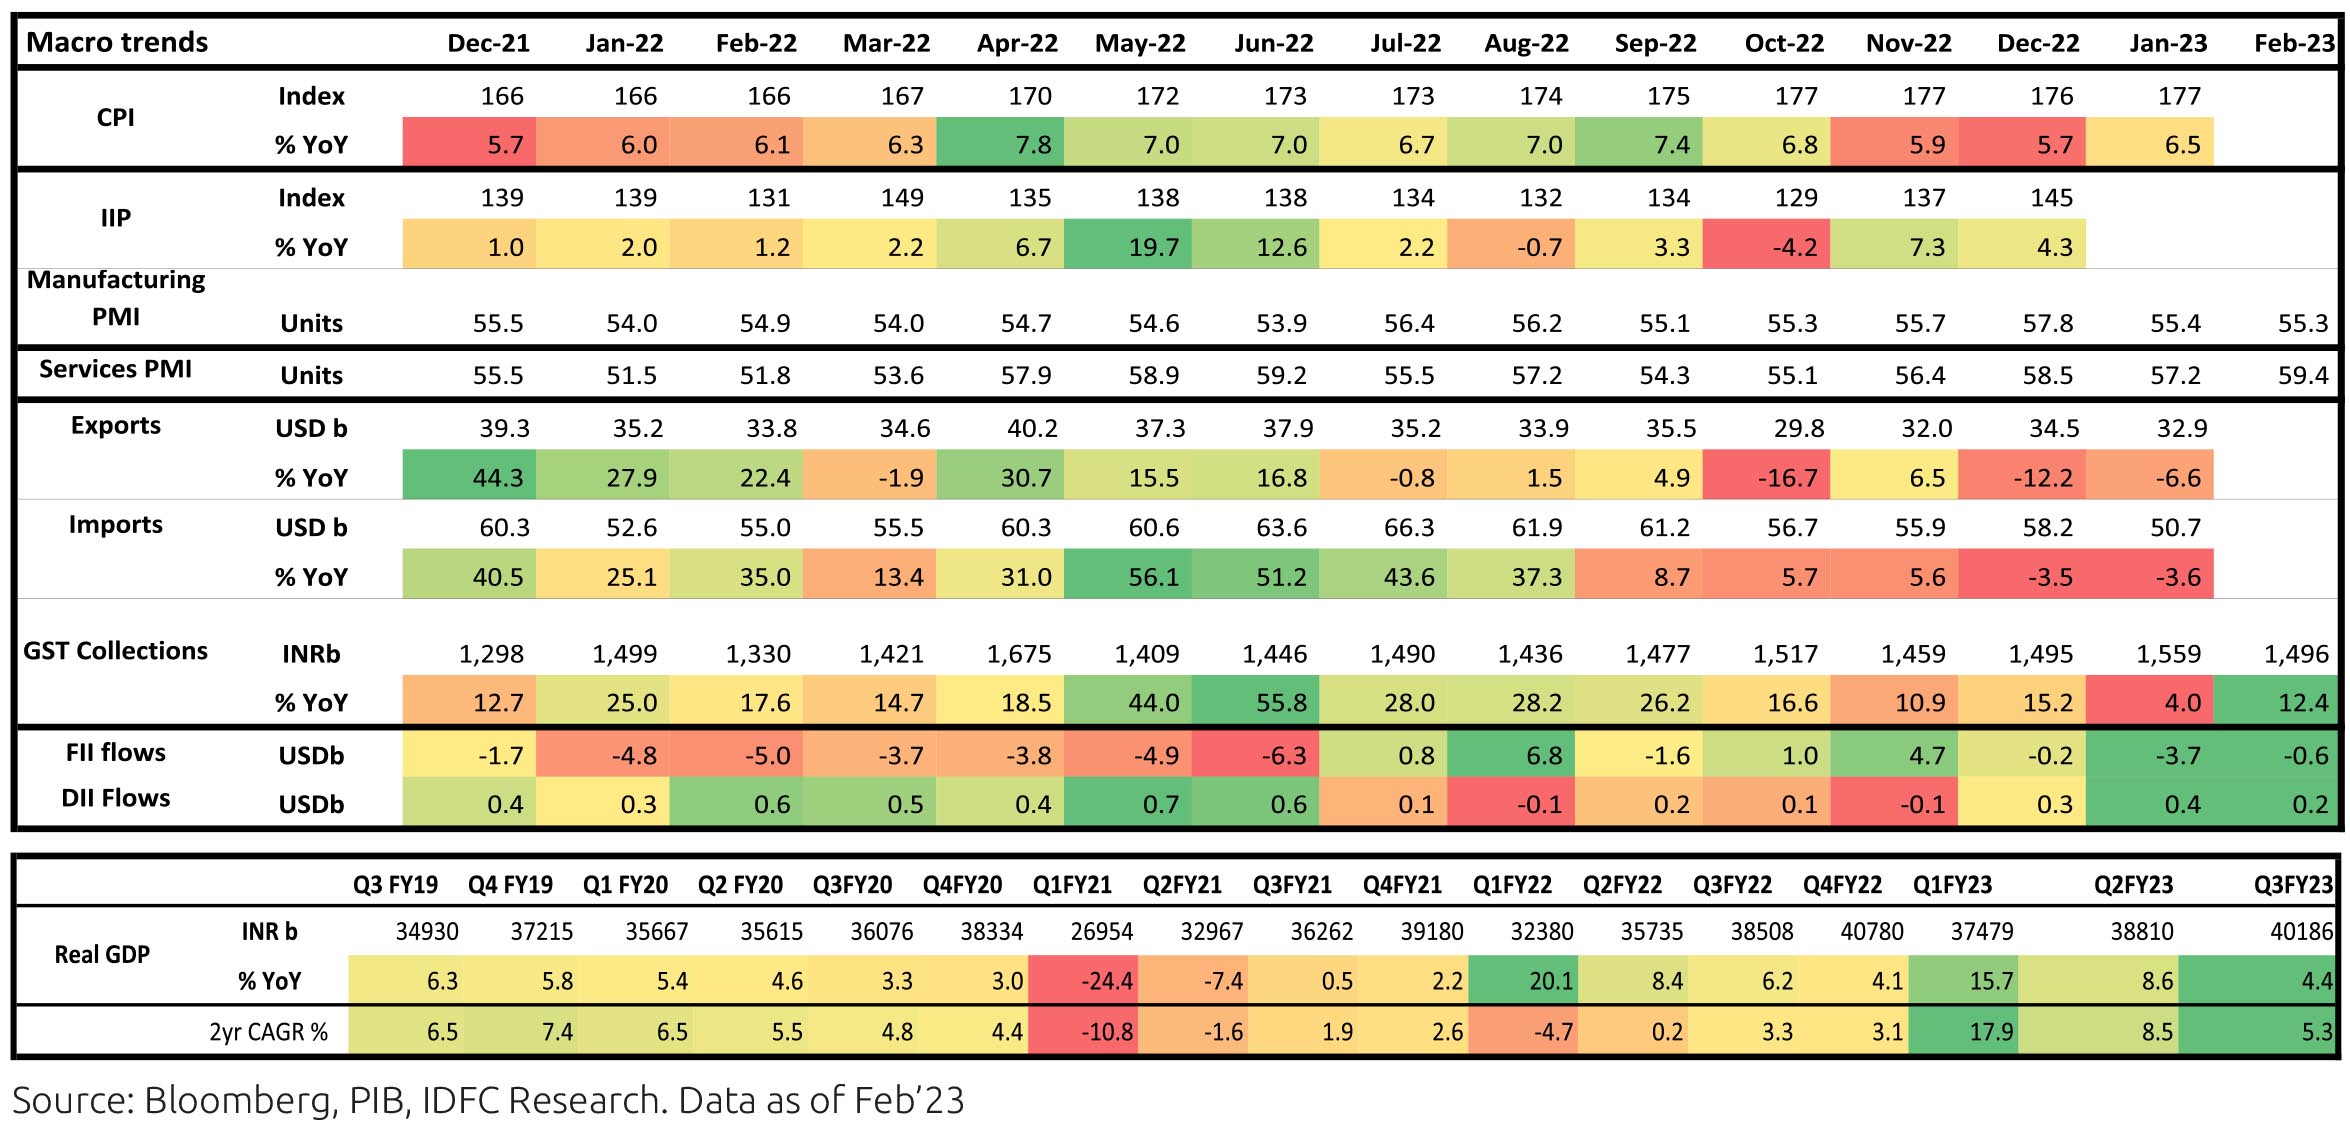
• 3QFY23 Real GDP growth moderated to 4.4%. However, the NSO retained its FY2023 growth at 7%. External demand has held up better than domestic demand, likely due to strong services exports. On the domestic demand side, the slowdown is pronounced in consumption due to sustained inflation.
• January CPI inflation surprised sharply on the upside at 6.5% (December: 5.7%), mainly led by MoM rise in cereals prices despite some contraction in Vegetable prices.
• January Exports fell by 6.6% YoY while Imports fell by 3.6% YoY. India's trade deficit decreased to a 12-month low of USD 17.7bn in January 2023 largely led by sequential moderation in imports.
• GST collections continued to be steady, with January collections at Rs 1.5bn growing at 12.4%
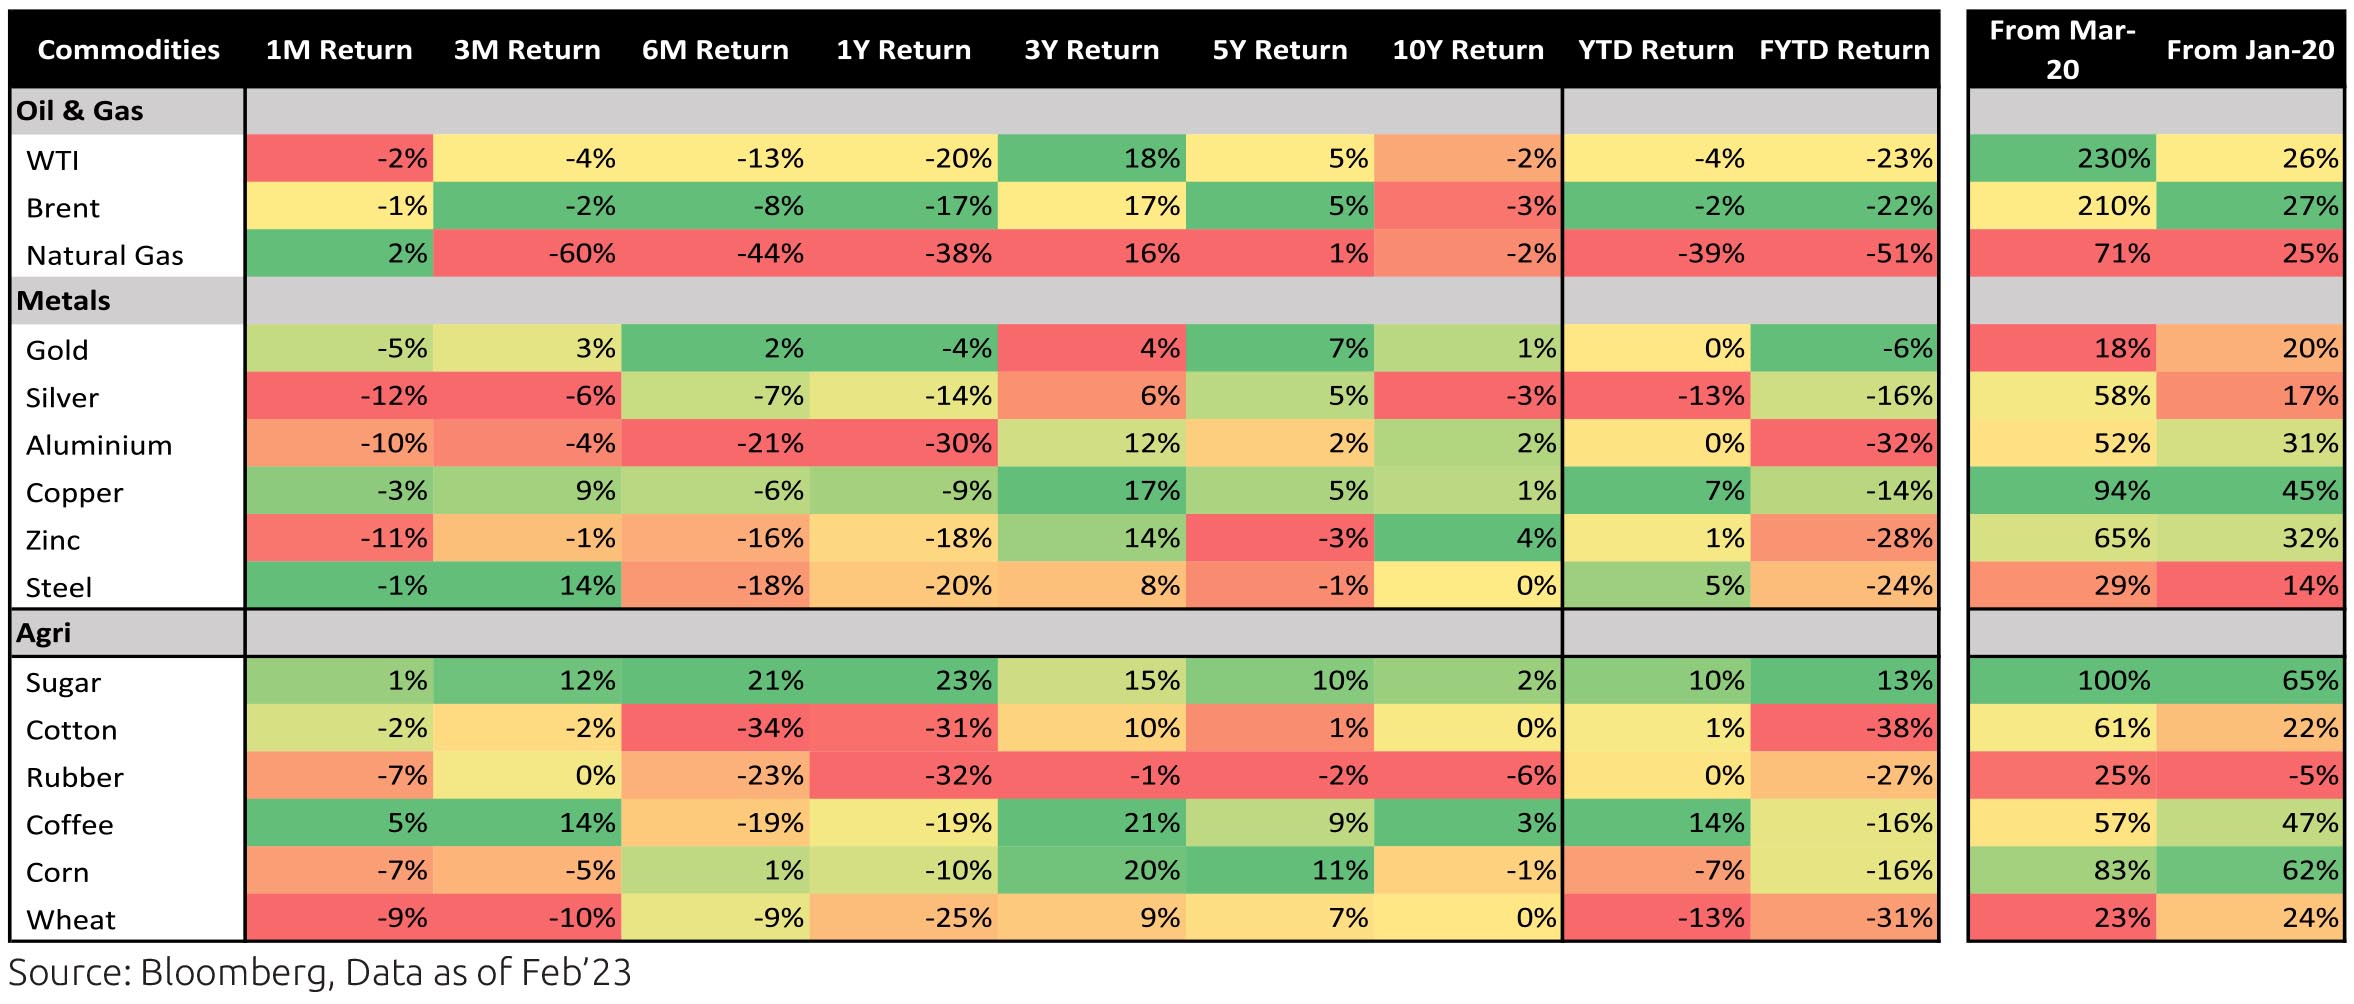
• INR depreciated by 0.9% MoM in Februry and has been flattish YTD. The DXY (Dollar Index) strengthed 2.7% over the month. Brent crude prices declined by ~1% MoM.
• FIIs continued their selling for the 3rd consecutive month with outflow of -$0.6bn in February (following $3.7bn in January). DIIs saw buying of $0.2bn in February, keeping on trend with the previous months.

Indian equities has corrected sharply on a YTD basis ($ terms, -7.6% YTD) compared to the World ($ terms, 4.3% YTD) and Emerging countries ($ terms, 0.8% YTD) which are holding their which are still in positive.

Domestic Markets
Sector performance was a mixed bag as NIFTY ended the month declining -2.2% MoM. Most of the sectors were in red barring FMCG and Capital goods sector which have remained flatish. Oil & gas, Metals and Utilities sector were the key drags for the month.


Macro Economics:
• 3QFY23 Real GDP growth moderated to 4.4%. However, the NSO retained its FY2023 growth at 7%. External demand has held up better than domestic demand, likely due to strong services exports. On the domestic demand side, the slowdown is pronounced in consumption due to sustained inflation.
• January CPI inflation surprised sharply on the upside at 6.5% (December: 5.7%), mainly led by MoM rise in cereals prices despite some contraction in Vegetable prices.
• January Exports fell by 6.6% YoY while Imports fell by 3.6% YoY. India's trade deficit decreased to a 12-month low of USD 17.7bn in January 2023 largely led by sequential moderation in imports.
• GST collections continued to be steady, with January collections at Rs 1.5bn growing at 12.4%
• INR depreciated by 0.9% MoM in Februry and has been flattish YTD. The DXY (Dollar Index) strengthed 2.7% over the month. Brent crude prices declined by ~1% MoM.
• FIIs continued their selling for the 3rd consecutive month with outflow of -$0.6bn in February (following $3.7bn in January). DIIs saw buying of $0.2bn in February, keeping on trend with the previous months.


Market Performance
Outlook
The December quarter results on a broad level indicated weak volume trends and easing of pricing pressures. Consensus FY23 EPS estimates for MSCI India were cut by ~5% this December quarter following a 4% cut post previous quarter results. Nifty FY23E EPS estimates has seen 1-2% cut with downgrades in commodities offset by upgrades in banks. The management outlook going ahead also saw some bit of moderation both from demand as well as margin perspective (barring staples and non-Auto Discretionary) reflecting the slowing global macro environment.
At a global level the macro outlook has turned challenging due to inflation data turning adverse. Across countries like USA, India, Germany etc. the recent inflation data has turned out higher than expected which is pushing global bond yields higher. The 2 year bond yield in USA is the highest since 2007. Higher bond yields are a big headwind to equities, and inflation will need to moderate for equites to perform. The silver lining for India is that earnings outlook is fairly resilient and over last few quarters valuation multiples have corrected.
Note: The above graph is for representation purposes only and should not be used for the development or implementation of an investment strategy. Past performance may or may not be sustained in the future.
India's nominal GDP growth moderated to 11.2% y/y in the December quarter after 17.2% in the September quarter. On a
real basis, growth was 4.4% y/y after 6.3% (1.0% after 1.8% on a seasonally adjusted q/q basis). Real private final consumption
growth slowed to 2.1% y/y in the December quarter from 8.8% in the September quarter. For the same period, manufacturing
was -0.2% y/y after -0.7% and services was 3.2% after 5.3%. The full year real GDP growth estimate for FY23 was retained at 7%
y/y which implies real GDP growth of 5.1% y/y in the March quarter. These numbers were released alongside upward revisions to
previous year growth numbers. For e.g., real GDP growth was revised up for FY21 from -6.6% to -5.7% and for FY22 from 8.7%
to 9.1%.
Consumer Price Index (CPI) inflation in India surprised to the upside at 6.5% y/y in January, after 5.7% in December, as momentum in food prices was higher than expected. This was mainly driven by the continued rise in price of wheat and slower-than-expected disinflation in vegetables. Core inflation (CPI excluding food and beverages, fuel and light) stayed high and sticky at 6.1% and has averaged the same from April 2022, after 6% in FY22. Real time prices of certain vegetables continue to ease sequentially and that of wheat has also fallen after several months, latter mainly due to the recent open market sale by the Food Corporation of India. However, the impact of higher-than-normal temperatures across the country on the harvest of the standing wheat crop, procured from mid-March, is to be watched closely as this happens in the context of rising cereal prices after last year's procurement was severely impacted by heat waves.
On FYTD fiscal data during April-January of FY23, central government net tax revenue growth was 9.1% y/y while total expenditure grew 12.8%. Fiscal deficit so far is thus 67.8% of FY23 revised estimate vs. 59.2% this time last year. Small savings inflow during April-January of FY23 was lower than that during the same period of last year and needs to be ~Rs. 84,000cr higher during the remaining fiscal year (vs. last year). GST collection was buoyant at Rs. 1.5 lakh crore and 12.4% y/y during February.
Industrial production (IP) growth was 4.3% y/y in December after 7.3% in November. However, on a seasonally adjusted monthon- month basis, it was -0.9% in December after +6.7% in November. Output momentum turned negative in all categories, except primary goods, after it had turned positive in November. Infrastructure Industries output (40% weight in IP) grew 1.6% m/m (seasonally adjusted) in January after 1.9% in December.
Bank credit outstanding as on 10th February was up 16.1% y/y, slightly down from the growth during October-December, and has averaged 14.7% since April 2022 (after 8% during January-March of 2022). This is partly also due to higher inflation and thus higher demand for working capital. Bank deposit growth is at 10.2% as on 10th February. Credit flow till date during the financial year has been much higher, than in the previous two financial years, with strong flows to personal loans (39% of total flow) and services (32% of total flow).
Merchandise trade deficit for January fell to USD 17.7bn from USD 22.1bn in December. In January, oil exports were down m/m and non-oil exports moderated slightly but oil imports and non-oil-non-gold imports fell strongly. Trade deficit had picked up from September 2021 (average of USD 21.8bn since September 2021 vs. USD 10.8bn during April-August 2021 when non-oilnon- gold imports picked up to an average of USD 38.4bn vs. USD 29.3bn) but it is off the recent high of USD 29.3bn in September 2022. Services trade surplus has also surprised to the upside in recent months.
Among higher-frequency variables, number of two-wheelers registered picked up sharply from October (likely also festive season effect) but eased thereafter. However, this has improved mildly in January-February. Energy consumption level picked up from November and is above previous year levels. Monthly number of GST e-way bills generated continues to remain strong at 8.2cr units in January. It averaged 7.9cr in the September quarter and 8.1cr in the December quarter.
US headline CPI was at 6.4% y/y in January after 6.5% in December, driven mainly by momentum in energy prices turning positive and continued strength in services such as house rent. Core CPI was at 5.6% in January after 5.7% in December. US non-farm payroll addition in January (517,000 persons) was a very strong surprise vs. expectations after December (260,000 persons). Unemployment rate eased further to a low of 3.4% and Labour Force Participation Rate inched up. Sequential growth in average hourly earnings was at 0.3% in January after 0.4% in November. Non-farm job openings as per the Job Openings and Labor Turnover Survey (JOLTS) fell by 0.4mn in January after increasing by 0.5mn in December. Overall, the US labour market stayed strong. The FOMC (Federal Open Market Committee) raised the target range for the federal funds rate, by 25 bps on 01st February and a total of 450bps since 2022, to the 4.50-4.75% range. The Fed Governor in his interaction after the FOMC meeting said the focus is not on short-term moves in financial conditions (which eased from late-2022 to mid-February of 2023) but on sustained changes, that it expects to see disinflation in core-services-ex-housing, although he pushed back on likely rate cuts in 2023. However, after the recent round of strong US economic data (non-farm payroll, PMI, Core PCE prices, ISM manufacturing prices, etc.), the Fed Governor in his testimony to Congress on 07th March said peak policy rates could be higher than previously expected and pace of rate hikes could also be higher if needed.
The European Central Bank's Governing Council, in its monetary policy decision on 01st February, raised all the three key interest rates by 50bps, a total of 300bps so far in this cycle. It said it will stay the course in raising rates significantly at a steady pace and in keeping it at levels that are sufficiently restrictive to ensure a timely return of inflation to 2%. It also said it intends to raise rates by another 50bps in March (unless there is some extreme scenario) after which it will then evaluate the subsequent path. Recent commentary from various ECB Governing Council members continue to be about the need to tame inflation through further rate hikes, even at the cost of low growth.
Outlook
There is little precedence from recent history of this magnitude of DM tightening over such a short span of time. As is well known, monetary policy acts with a substantial lag. Thus concurrent data probably is an even poorer indicator of the future than is usually the case, since the amount of pipeline tightening yet to hit economic activity is much more than is usually the case in a normal tightening cycle. This is true for India as well, although to a lesser degree. Thus even in India there has been close to a 400 bps rise in the 1 year treasury bill rate as an example, from its (admittedly untenable) low hit just over a year back. Tightening of this magnitude is bound to affect economic activity, especially as we didn't see anywhere close to the kind of fiscal and monetary expansion that DMs did.
We had earlier assessed the February rate hike to be the last for India. However, a marked overshoot in the January CPI print alongside escalating weather threats on agricultural production mean that a last interest rate hike is now on the table for the April policy thereby setting a 6.75% terminal repo rate for this cycle. This would mean that the policy rate differential between India and US will likely be just over 100 bps at the respective cycle peaks. We expect the differential to open up again when the rate cut cycle commences, possibly starting 2024. The Fed will have peaked much higher than long term neutral and correspondingly will have much more room than RBI on the way down. Markets seem to be pricing as much as well which seems getting reflected in longer tenor US yields.
Bond markets have more than fully priced in this final rate hike over the past few weeks. This doesn't mean that incremental volatility won't be there, but just that volatility is now very much in a digestible range. Reflecting incremental hike expectation and a rapidly tightening liquidity environment, alongside good long duration demand towards year end, the yield curve has virtually entirely flattened. Over the course of the year ahead, we expect two things to happen: One the yield curve should incrementally steepen somewhat. While the near trigger for this is dependent upon the distribution of the government borrowing calendar, we are more confident of it happening towards the latter part of the year when markets are likely to start building in some modest policy easing. Two, credit spreads should begin to open up, especially for lower rated issuers reflecting a tighter refinancing environment. Given the above, our preferred overweight remains 3 - 6 years maturing government bonds wherever allowed by scheme mandates. A related point needs making: while elevated money market rates make utmost sense for short term investors of up to 1 year horizons, longer term investors are probably ignoring future re-investment risks by tying themselves too much into 1 year deposits. The 3 - 6 year segment may be much better placed for such investors, in our view.
It is our strong view that this is the period to build quality fixed income allocation. The global economic narrative will likely turn more uncertain (ex-China) as the cumulative global tightening shows. Local bond market volatility is now within manageable ranges. Bond yields even of best quality are now beating expected inflation on almost any forward looking timeframe. And finally, spreads on lower rated credits are low enough that one need not bother there. These should constitute more than adequate reasons for now going overweight quality fixed income, not just for traditional fixed income investors but also in a multi-asset allocation framework.


