Commentary

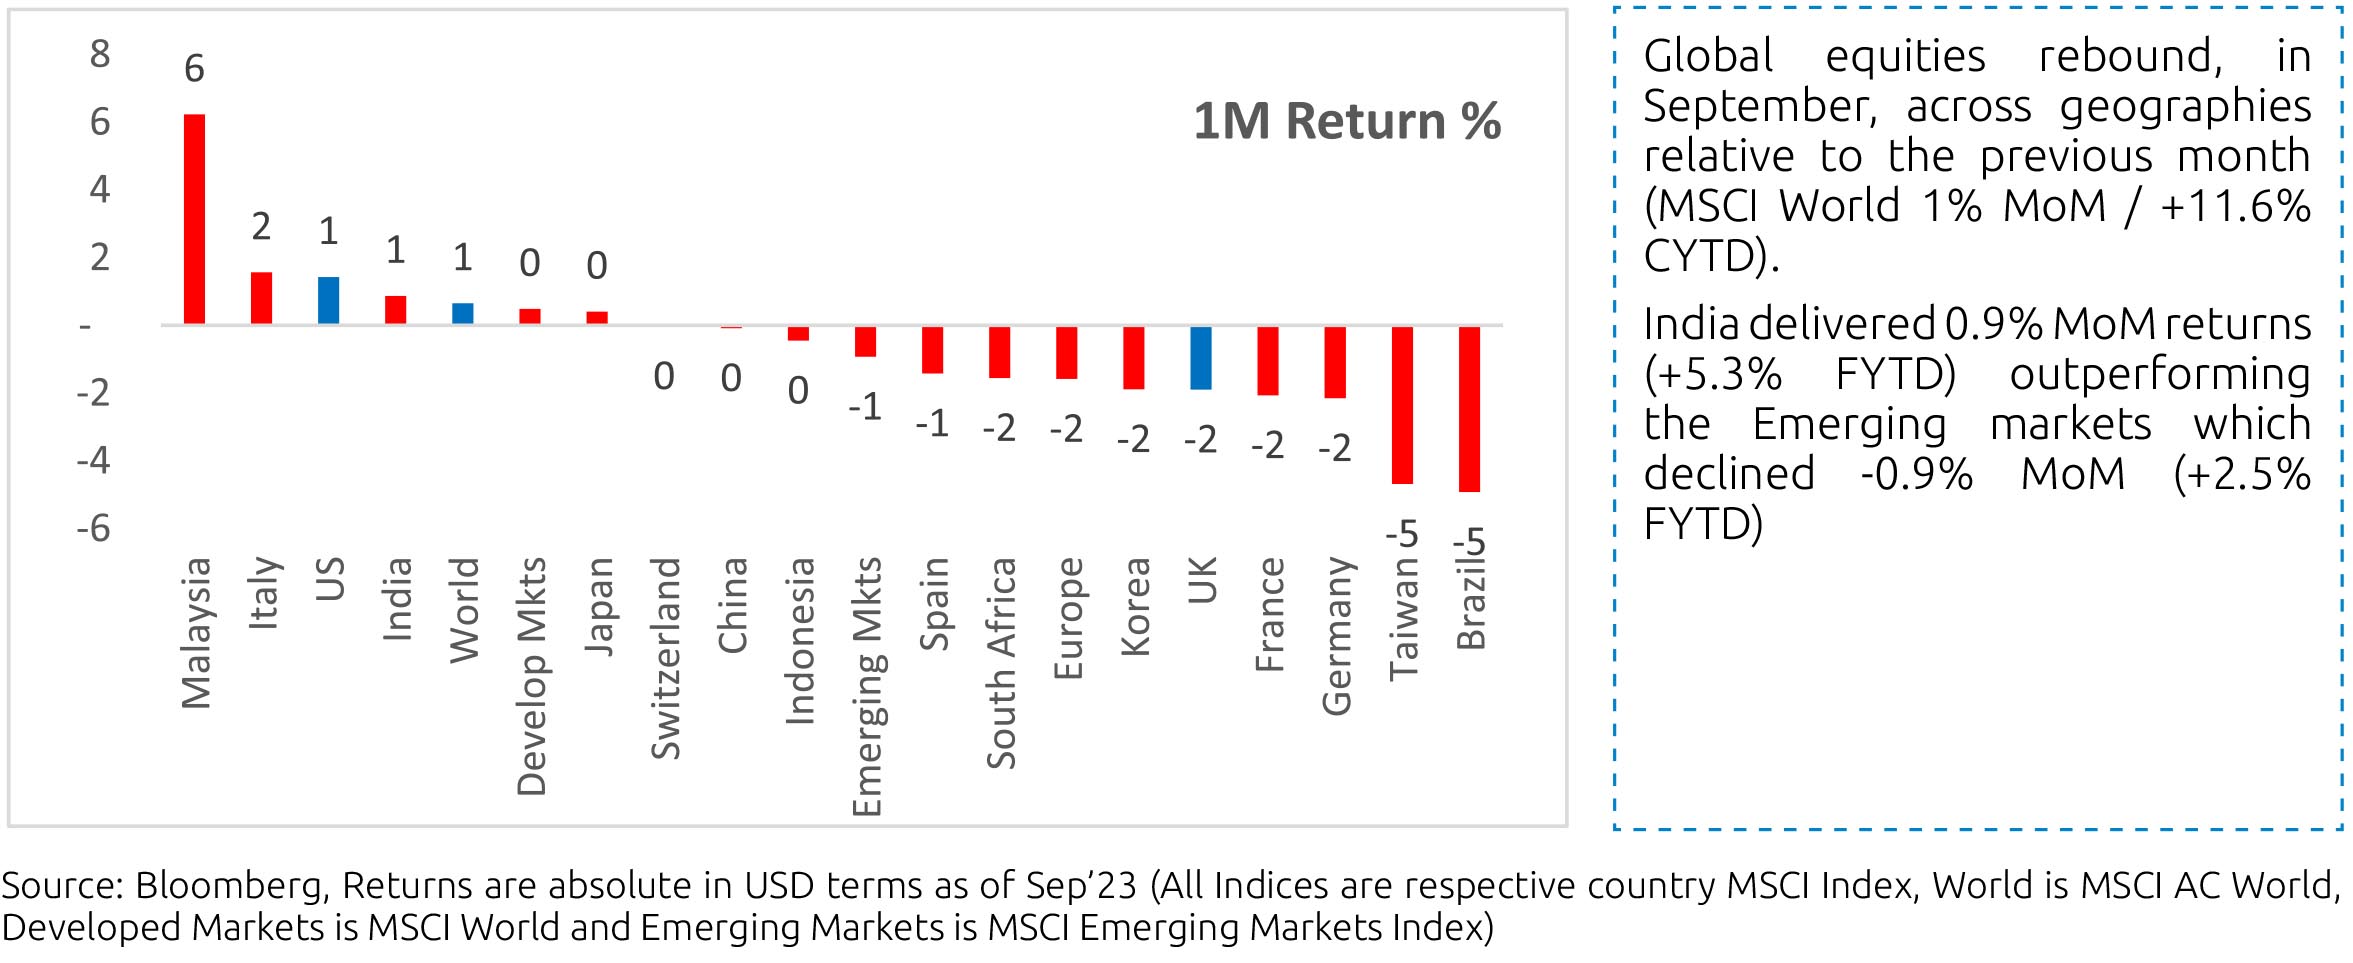
How has the global market performed?
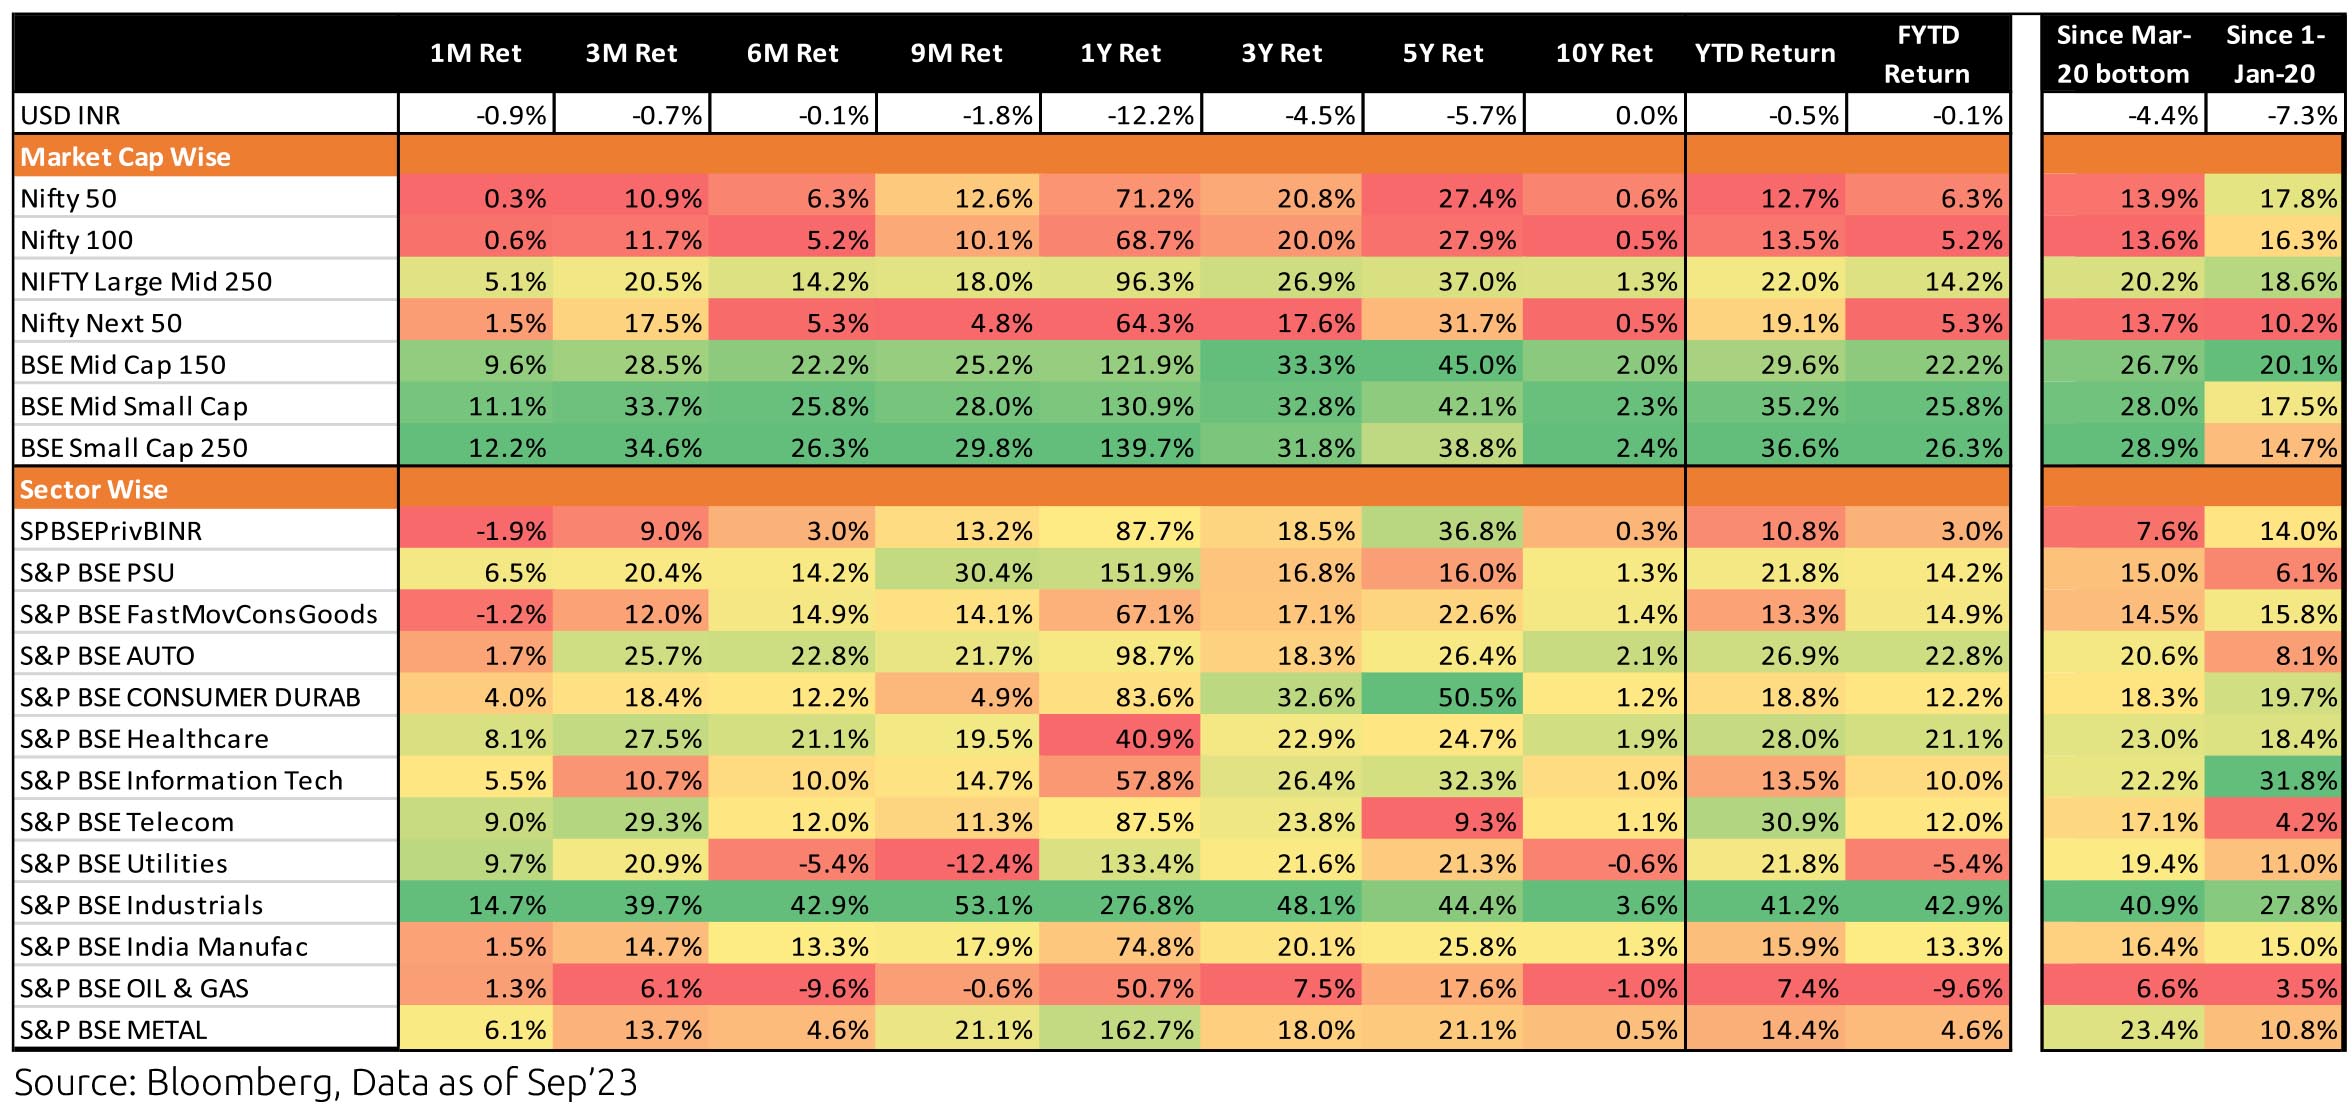
Comparative: India's performance has lagged on CYTD, but remains competitive on a 1-year, 3-year and 5-year return basis.
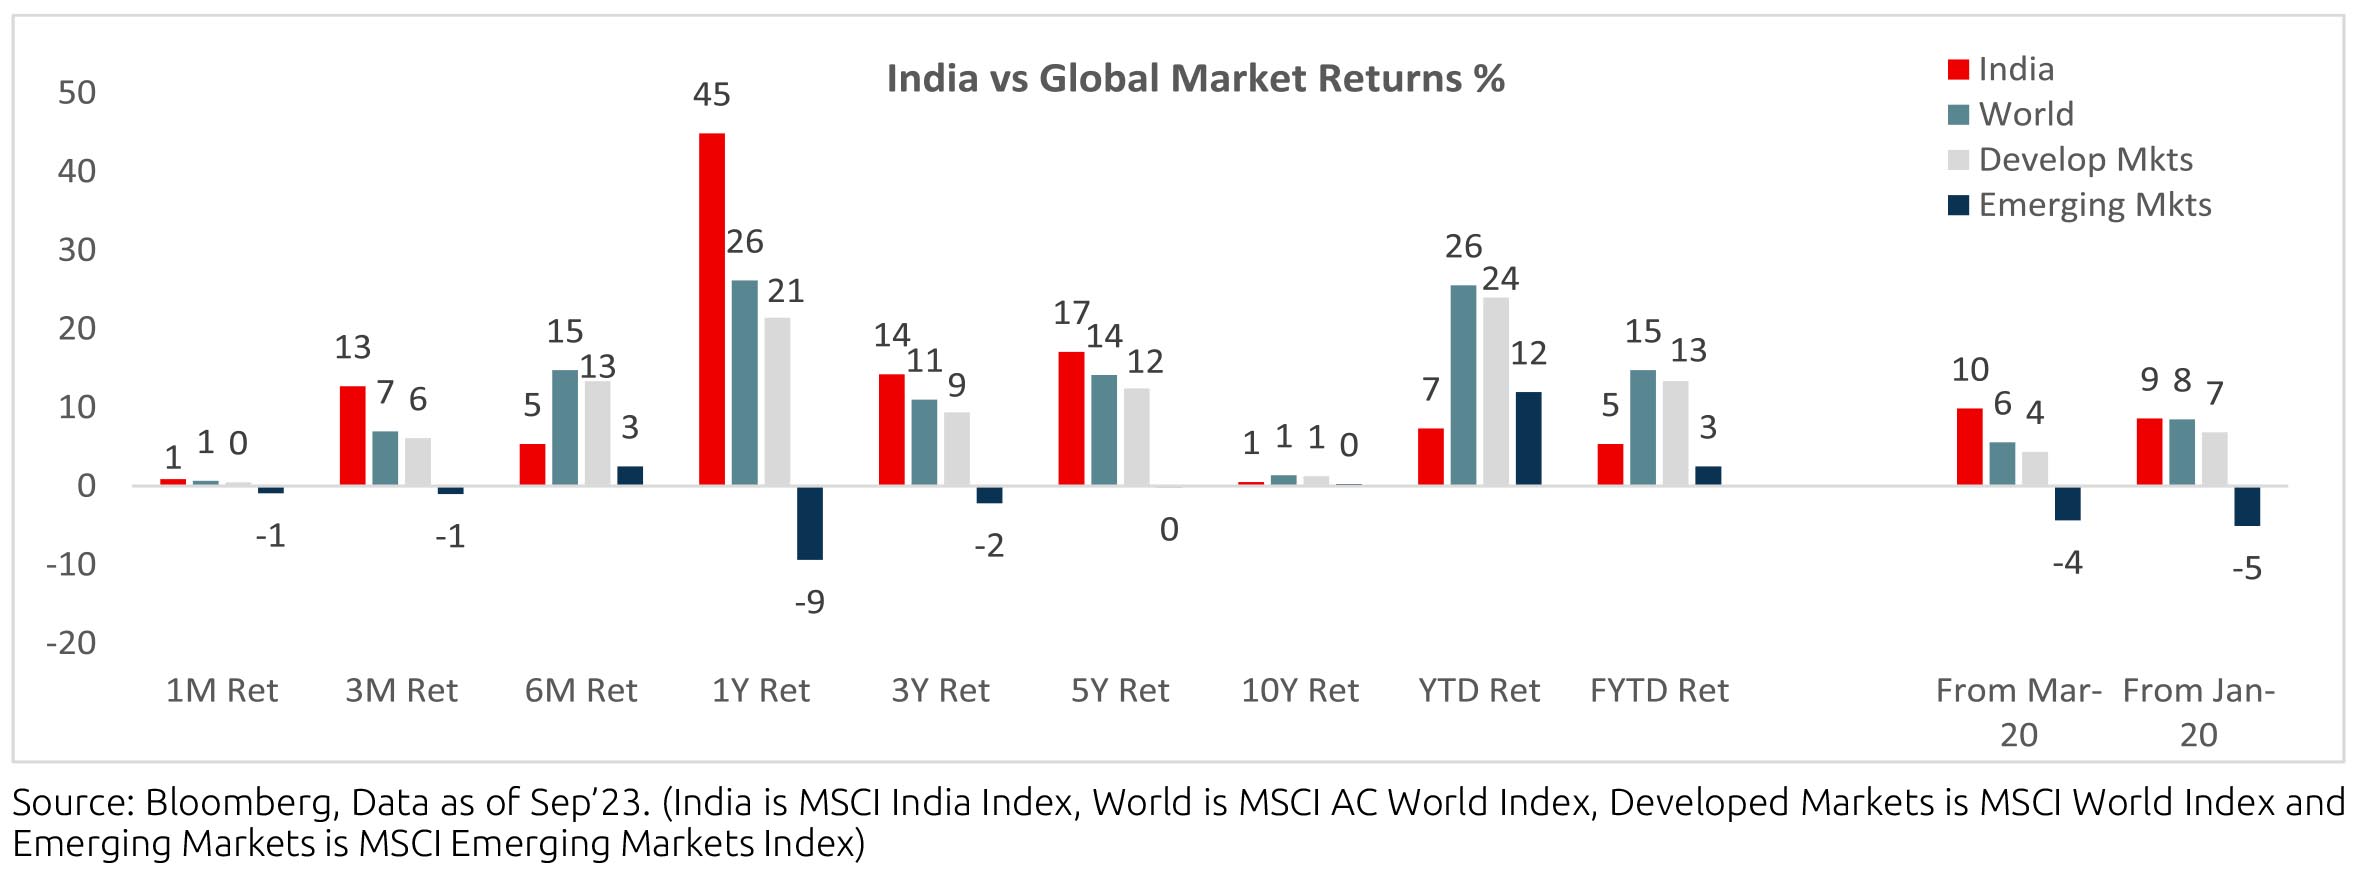
How has the Indian Market performed?
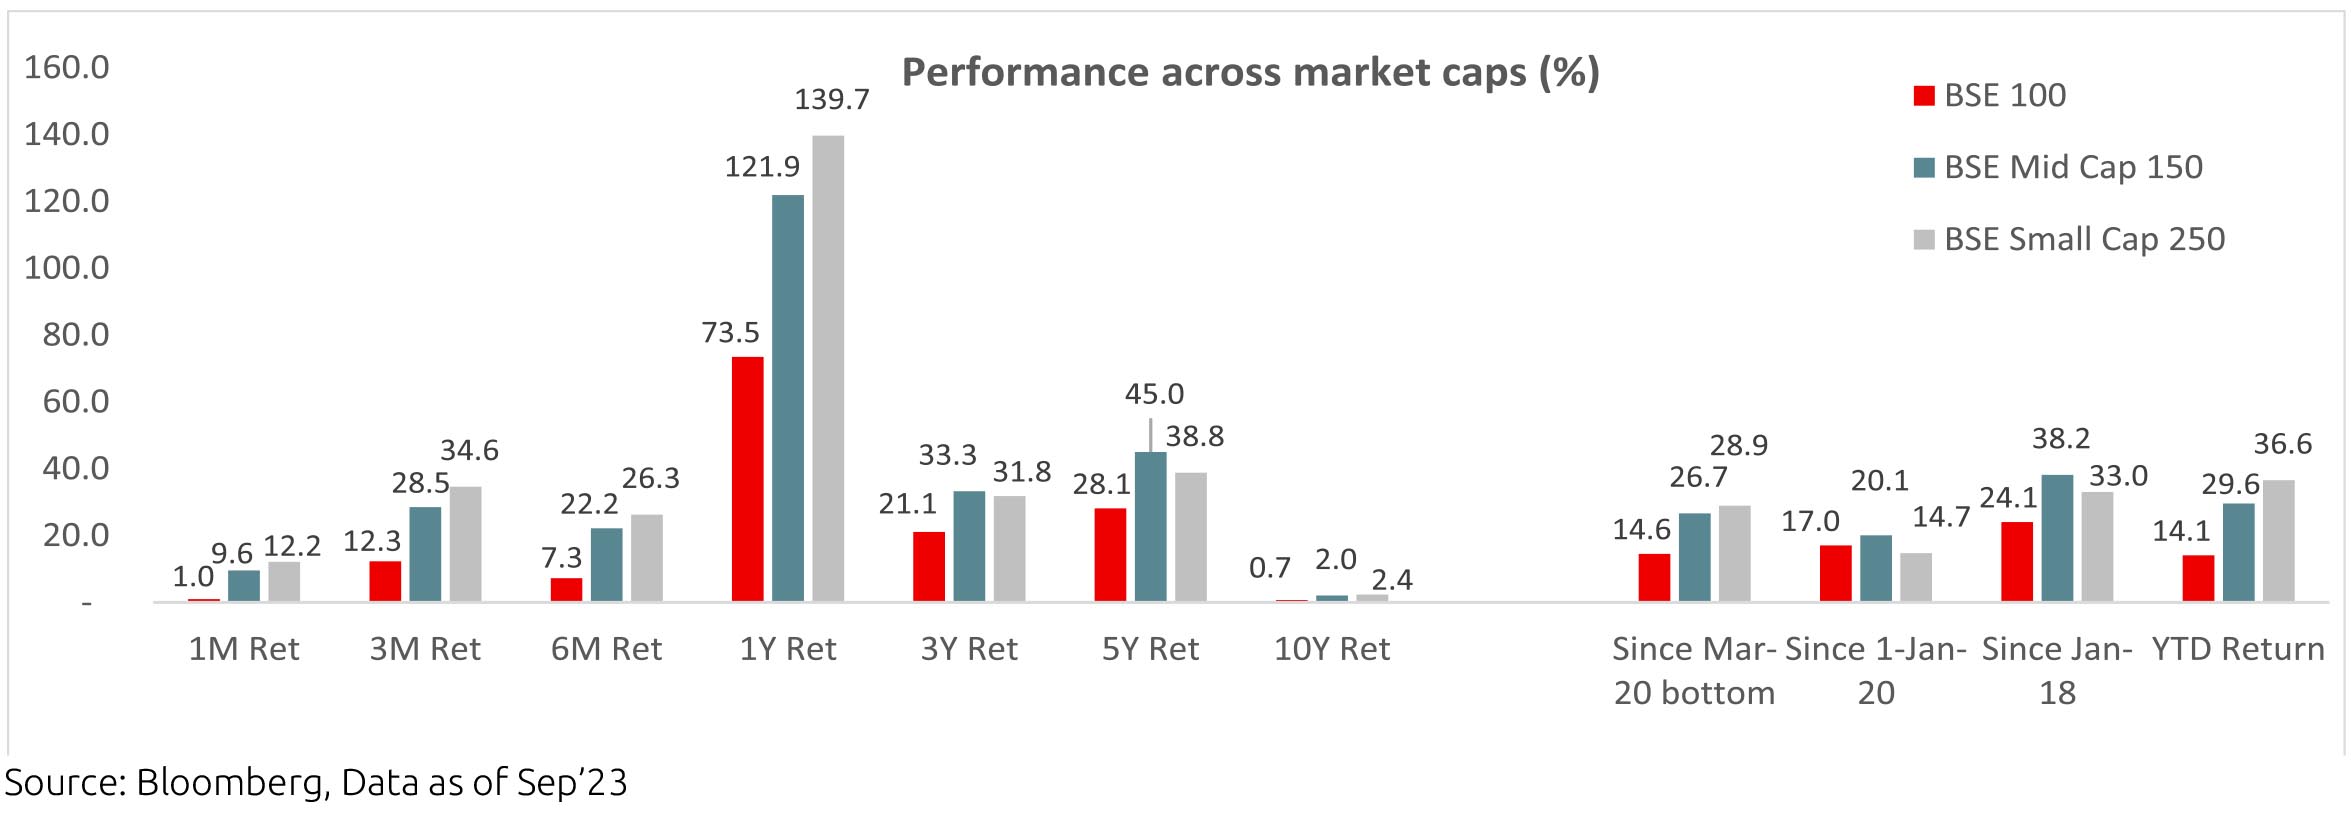
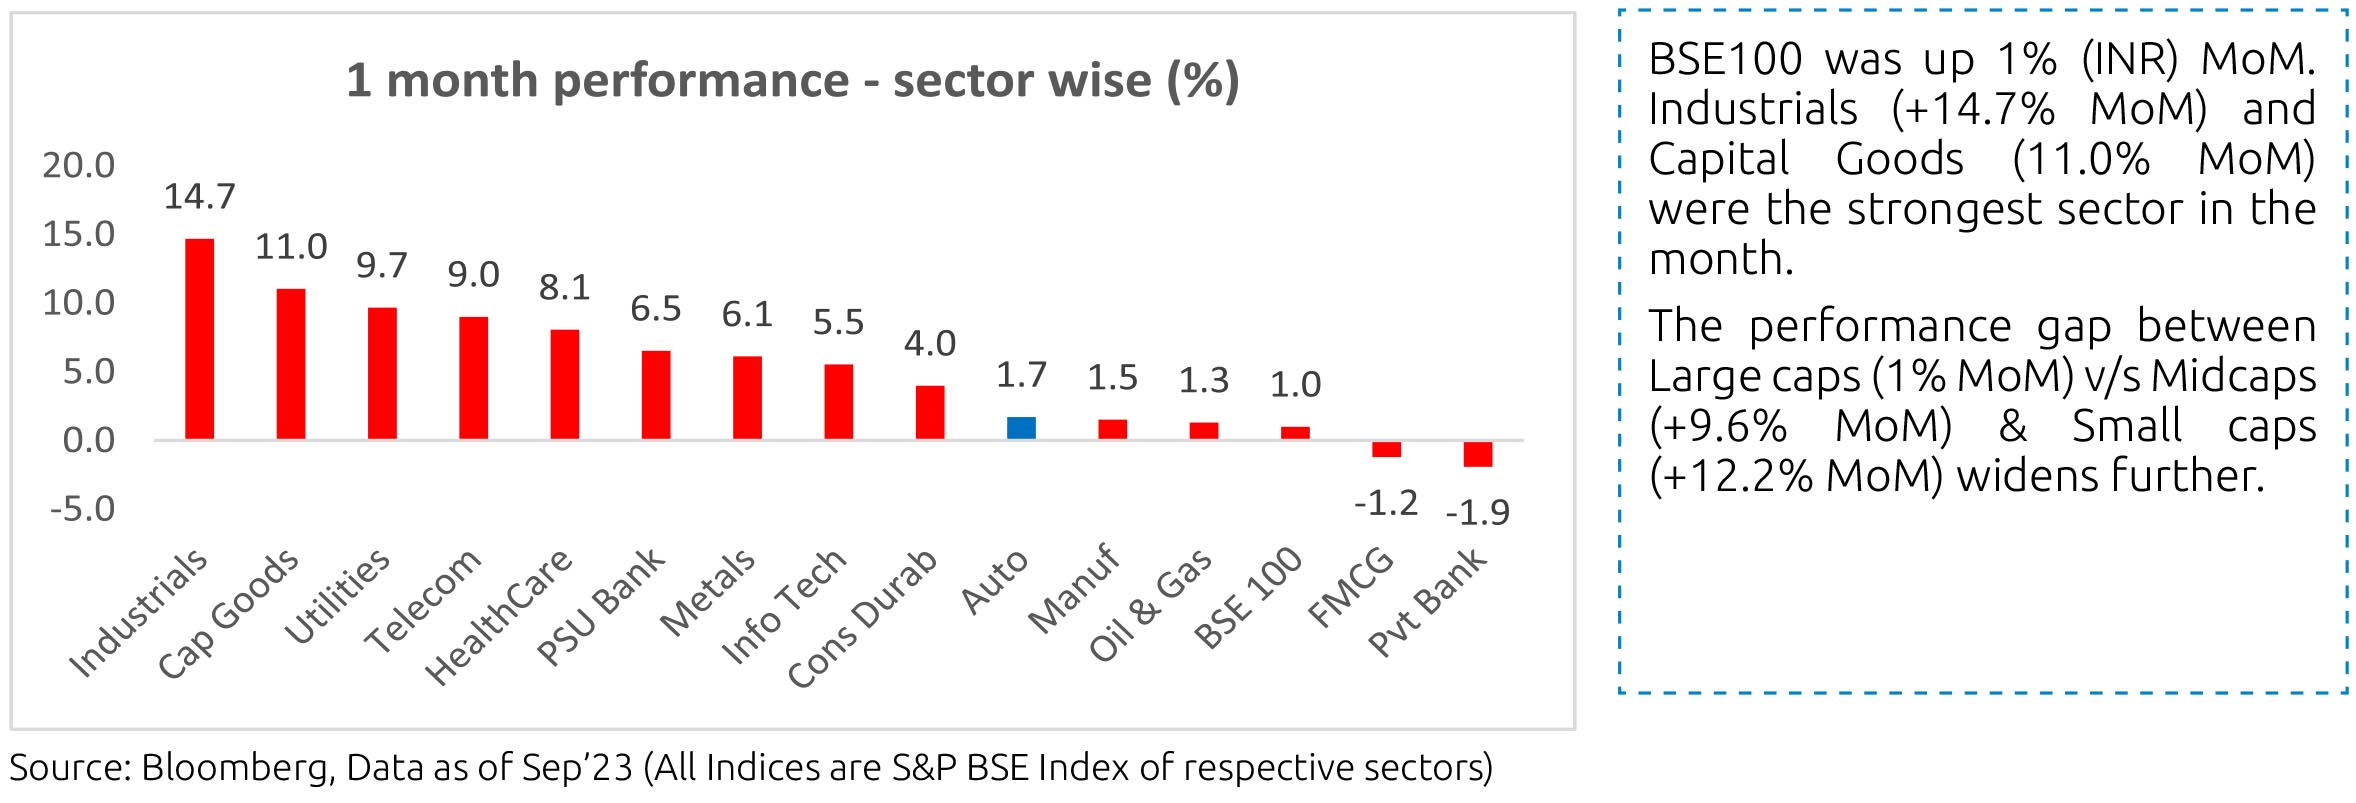
Market Performance
Equity Outlook
All three indices - Large, Mid and Smallcap - were positive for September 2023. However, the markets felt nervous given the macro headwinds - high oil prices, global dollar appreciation, long-term term yields in the US, and forthcoming state elections. The rise in US bond yields seems unsettling, with the ten year yield up approximately 80bps in the last 3 months. Given the high fiscal deficit, the supply of US bonds is proving to be challenging as two big buyers in recent times - the Fed and foreign countries (China, Saudi, etc) are not adding incrementally.
On the other hand, the domestic economy indicators continue to display reasonable momentum with capex and affluent consumption being the relatively strong pockets. Our portfolios are broadly positioned to ride the domestic economy, but we need to monitor the risks of adverse global developments on the domestic economy along with political developments ahead.
On central government fiscal data for April-August, net tax revenue growth was up 14.8% y/y as corporate ad income taxes
picked up in August. Total expenditure was up 20.3%y/y, with both revenue and capital expenditure stronger. In terms of
financing the fiscal deficit, small savings collection was stronger by around Rs. 52,000cr from the same period of last year. In
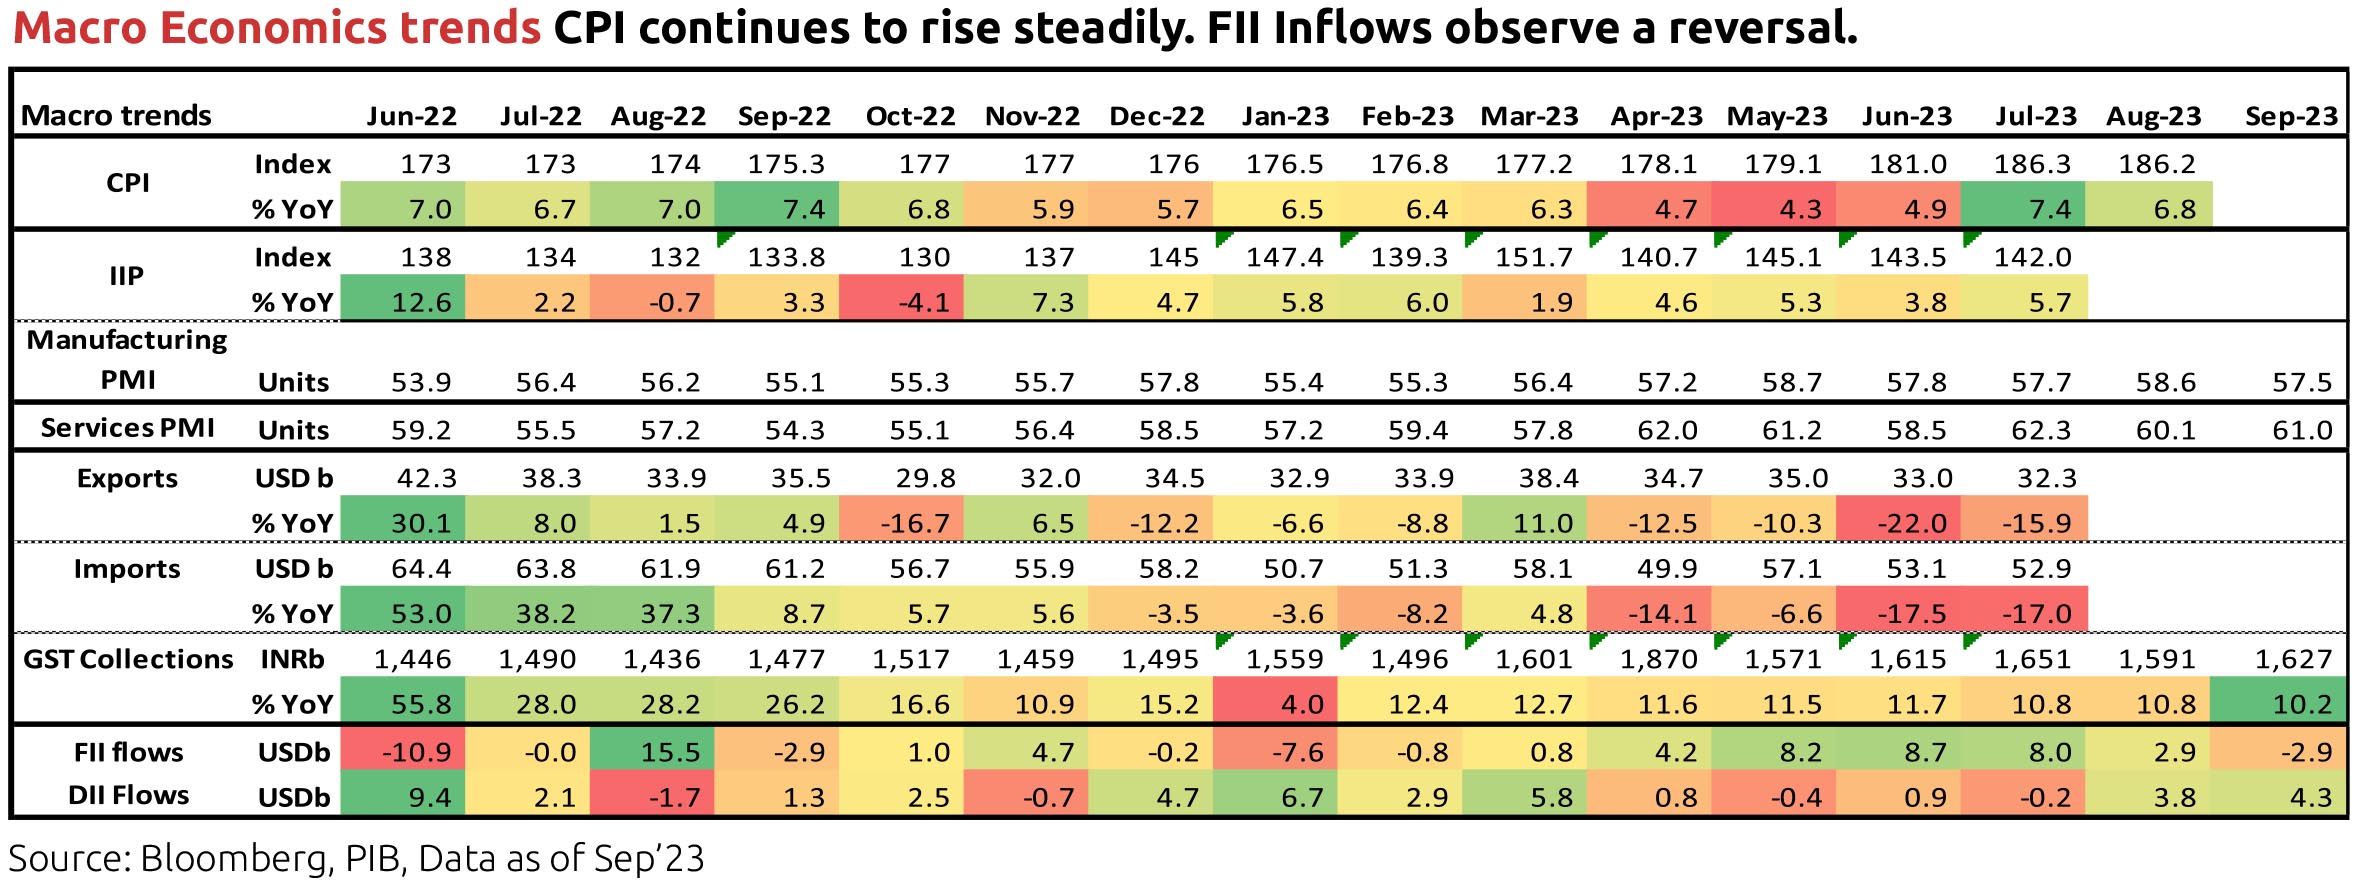
September, GST collection remained robust at Rs. 1.6 lakh crore and 10% y/y.
After the spike in India's inflation to 7.4% y/y in July, mainly driven by the surge in tomato prices, it eased to 6.8% in August. Overall food and beverages price momentum fell by 0.5% m/m as prices of vegetables, meat & fish and eggs eased but prices of cereals, pulses and spices continued to rise. Core inflation (CPI excluding food and beverages, fuel and light), which averaged 6.1% in FY23, moderated in recent months and eased further to 4.8% y/y in August, also due to base effects. Real time prices of tomatoes and certain vegetable oils continue to fall and LPG prices were cut by the government but prices of cereals, pulses and kerosene have moved up. Monsoon rainfall picked up in September, after a very weak spell in August, and ended the season 6% below the long period average. Global agencies continue to assign a high probability for El Niño conditions to continue at least till the end of this year. El Niño is typically associated with lesser southwest monsoon rainfall in India, although not a given, and thus potentially lower agriculture production. Reservoir water levels have improved but remain a risk for the following Rabi crop sowing season. Current kharif crop sowing for rice is slightly higher than last year, but very weak rainfall since August could impact final harvest and crop quality, while sowing in pulses is below last year levels. Government has been taking various supply side measures (procurement, open market sales, international trade, price rise mitigation, etc.) which also impact agriculture production and food inflation
Industrial production (IP) growth was 5.7%y/y in July after 3.8% in June. On a seasonally adjusted month-on-month basis, it was -1.9% in July after -0.3% in June. By category, output momentum contracted for primary, capital, intermediate, infrastructure & construction and consumer durable goods but turned positive for consumer non-durable goods. Infrastructure Industries output (40% weight in IP) increased 2.3% m/m (seasonally adjusted) in August, as output in cement, petroleum refinery products and electricity picked up. However, steel, fertilizer and natural gas output moderated.
Bank credit as on 22nd September was 20% y/y, including the impact of the merger of a non-bank with a bank from 01 July 2023. Excluding this, credit growth had been moderated from late October 2022. Latest bank deposit growth is at 13.2% and has averaged 11.5% so far in 2023. Credit flow in FY23 was much higher than in the previous two financial years with strong flows to personal loans (38% of total flow) and services (33% of total flow). Credit flow so far in FY24 (Apr-August) has also been higher towards services and personal loans.
Merchandise trade deficit for August increased further to USD 24.2bn, after it had increased to USD 20.7bn in July. In August, oil exports were up by USD 1.3bn from July and non-oil exports were up by USD 0.9bn. However, oil imports were also up by USD 1.5bn, gold imports by USD 1.4bn and non-oil-non-gold imports by USD 2.8bn. Trade deficit, after peaking in September 2022 at USD 28bn, had moderated before the pickup from May 2023. However, services trade surplus surprised to the upside from late 2022 with an average monthly surplus of USD 13.4bn in H2 FY23 vs. USD10.4bn in H1 FY23. This was at USD 12.5bn in July and August and averaged USD 12.1bn in Q1 FY24.
India's Current Account Deficit (CAD) for the June 2023 quarter moved higher to 1.1% of GDP, from 0.2% in the March quarter. Overall BoP surplus increased to USD 24.4bn from USD 5.6bn. For FY23, India's CAD was 2% of GDP (1.2% in FY22) and the overall BoP balance was USD -9bn (USD +48bn in FY22).
Among higher-frequency variables, number of two-wheelers registered has improved since mid of August and energy consumption levels have averaged 12.6% y/y during the week ending 08 October 2023. Monthly number of GST e-way bills was strong at 9.2cr units in September and has averaged 9.1cr in the September quarter, after 8.6cr in the June quarter.
US headline CPI was at 3.7% y/y in August after 3.2% in July, with base effects also in play. In August, price momentum in energy goods picked back up strongly but that in used vehicles was negative again and that in rent of shelter moderated. Core CPI was at 4.3% in August after 4.7% in July. Sequential momentum in headline CPI, core CPI and non-housing-core-services moved up. US non-farm payroll addition in September (336,000 persons) was well above expectation. However, growth in average hourly earnings was below expectation (0.2% m/m) while the unemployment rate, employment-population ratio and labour force participation rate stayed flat. Non-farm job openings as per the Job Openings and Labor Turnover Survey (JOLTS) was also higher than expected and picked up for the first time after three months to 9.6mn in August from 8.9mn in July. The jobopening- to-hires ratio for the non-farm sector is now 1.64, off the peak of 1.83 in March 2022 but higher than the pre-pandemic average of 1.18 in Jan-Feb 2020.
The FOMC (Federal Open Market Committee), after raising the target range for the federal funds rate in ten consecutive meetings from March 2022 by a total of 500bps, paused at its June meeting and then hiked again by 25bps (to the 5.25-5.50% range) at its July meeting. It paused again at its September meeting, when it also revised up its projections for the federal funds rate for 2024 and 2025, implying fewer policy rate cuts than in June. It also revised up its real GDP forecasts and revised down its unemployment rate forecasts.
The October'23 monetary policy review was status quo on policy stance and rates, as was widely expected. However, there was a lot under the hood that was very hawkish indeed. Domestic growth remains resilient, with risks largely from uneven monsoons and the external side. On inflation, the unwind in the recent surge in vegetable prices as well as the relatively well-behaved core inflation trends were welcomed. The latter has softened by 140 bps since January to 4.9% now, even as the Governor noted further disinflation in the core component as being critical for price stability. Importantly, household inflation expectations are in single digits for the first time since the pandemic. Nevertheless, there are risks from certain food items on account of lower Kharif sowing, El Nino conditions, global food and energy prices, and from global financial market volatility. There was a reiteration that CPI target is 4% and not 2 - 6%.
What turned out to be unpalatable for the bond market is the Governor saying that RBI may resort to OMO bond sales for liquidity management if the need should arise. In the post policy conference, he further clarified that though there is no calendar being given for OMO sales, whenever it happens, it will done via the auction route. This is different from the OMO sales that RBI has lately been conducting via the NDS OM platform. The latter have been for smaller amounts and have not been market moving. However, explicit sales via the auction route are a different cup of tea. Also, while nothing has been announced thus far the Governor has effectively unleashed a long sword of uncertainty on the market's head. There are certain aspects of the evolution of RBI's liquidity framework that we assess below.
Our understanding has been that RBI's liquidity model was anchored around targetting weighted average call rate using the VRRR as the primary tool for liquidity management. Thus so long as this was being achieved the actual quantity of liquidity in the system wouldn't matter as much. The usage of the temporary ICRR tool undertaken in the previous policy seemed to stem from RBI's frustration that banks' offtake of 14 day VRRR seemed patchy. To be fair, though, there were explicit comments then about the potential damage that may arise from excess liquidity. Even so, the understanding mostly was that preference was for shorter term tools rather than permanent measures as far as liquidity is considered. Thus apart from VRRR, one was hearing about RBI conducting short tenor sell-buy swaps in dollar-rupee as well. The recent OMO sales via NDSOM screen had been quite modest.
However, the intention now to step OMO sales leads to some questions. One, why was the ICRR tool introduced with such an explicit guidance on its unwind? Why was it not kept open ended to be unwound as and when liquidity conditions permitted it? The reason we ask these is as follows: As per our estimates core system liquidity is of the order of INR 3,25,000 crores post the I-CRR unwind. However, currency in circulation is expected to rise by INR 225,000 - 250,000 crores by end of March 24, as per normal seasonal trends. Further, the balance of payment has been quite healthy over the first half of the year and is unlikely to be the same over the rest of the year. While this is speculative and difficult to model, but already RBI's dollar sales have picked up. The point we are making is that, in all likelihood there is no reason at all to take permanent measures on liquidity mop up given that most of the core liquidity surplus is already poised to vanish by the financial year end. The bother really is the time it takes for this to happen and that is why the temporary measures made perfect sense and the permanent measures (like OMO sales) don't. The other argument is that, despite denying it publicly, RBI actually wants yields to adjust higher, probably reflecting the rise in global bond yields. We are less inclined to go with this argument since at best it is a slippery slope to manage for the central bank.
The developments in the latest monetary policy is a near term challenge to our overweight position in 9 - 14 year bonds in our active duration funds. Our fundamental premise here was a more favorable demand - supply situation basis both the upcoming FPI inflows as well as due to the drop in net government bond supply starting this quarter. However, now RBI emerges a new supplier of government bonds. While there is no explicit calendar for this, as mentioned before a long sword hangs now that such OMOs can be announced any day. This is especially so since the market understands that the best of liquidity is likely over October - December quarter. Core liquidity may shrink enough by then (for reasons mentioned above) for RBI to not want to persist with OMOs from the next quarter. Thus the risk of this additional supply is more near term, and this may weigh more on the minds of market participants.
While the move is painful to our positioning, our view for now is to persist with the more medium term in mind. We list reasons below:
1. We provide below a summary of net government bond supply for the 4 quarters of the year:

As can be seen, even accounting for some OMO sales net supply for the rest of the year will still be substantially lower than for the first half of the year gone by. Thus we don't expect demand supply to be deeply out of skew unless the OMO sales are very large (not the base case).
2. We don't know the amount, frequency, or tenor distribution of the OMOs. If as an example, RBI chooses to focus more on very short tenor bonds then the market needn't have to worry as much eventually as it is worrying today. Put another way, the uncertainty regarding this announcement is at its highest currently and that is getting reflected in the free fall in bond prices at the time of writing.
3. This is more a macro positive and doesn't pertain as much to the immediate issue. One of the risks to the bond view we had mentioned earlier is that of substantial fiscal slippage. This was basis fiscal data till July 23. However, August data has seen a surge in tax revenues and has been a bit of a game changer. For contrast, below we present some cuts on year to date fiscal data till August vs till July.


As can be seen, the recovery is remarkable and substantially brings down the run rate required for the rest of the year. This substantially reduces the chances of any meaningful fiscal slippages.
Outlook
The risk so far one was contending with for a long bond view was chiefly from US yields. The potential OMO announcement has now introduced a local risk. Given that this was unanticipated and remains uncertain in contours, the reaction for the time being has been large from market participants. However, the underlying framework remains broadly the same. Eventually, the local trigger will likely count as a small blip in some sense. US bond yields are a more persistent variable to monitor in the near term but for reasons discussed before, we think it highly likely that these stabilize as well in the medium term. We continue with our overweight stance in 9 - 14 year government bonds in active duration bond and gilt funds. Short and medium duration funds continue overweight 3 - 6 year with overweight on government bonds vs corporate bonds wherever the mandate allows for it.
Source: Bandhan MF Research
After the spike in India's inflation to 7.4% y/y in July, mainly driven by the surge in tomato prices, it eased to 6.8% in August. Overall food and beverages price momentum fell by 0.5% m/m as prices of vegetables, meat & fish and eggs eased but prices of cereals, pulses and spices continued to rise. Core inflation (CPI excluding food and beverages, fuel and light), which averaged 6.1% in FY23, moderated in recent months and eased further to 4.8% y/y in August, also due to base effects. Real time prices of tomatoes and certain vegetable oils continue to fall and LPG prices were cut by the government but prices of cereals, pulses and kerosene have moved up. Monsoon rainfall picked up in September, after a very weak spell in August, and ended the season 6% below the long period average. Global agencies continue to assign a high probability for El Niño conditions to continue at least till the end of this year. El Niño is typically associated with lesser southwest monsoon rainfall in India, although not a given, and thus potentially lower agriculture production. Reservoir water levels have improved but remain a risk for the following Rabi crop sowing season. Current kharif crop sowing for rice is slightly higher than last year, but very weak rainfall since August could impact final harvest and crop quality, while sowing in pulses is below last year levels. Government has been taking various supply side measures (procurement, open market sales, international trade, price rise mitigation, etc.) which also impact agriculture production and food inflation
Industrial production (IP) growth was 5.7%y/y in July after 3.8% in June. On a seasonally adjusted month-on-month basis, it was -1.9% in July after -0.3% in June. By category, output momentum contracted for primary, capital, intermediate, infrastructure & construction and consumer durable goods but turned positive for consumer non-durable goods. Infrastructure Industries output (40% weight in IP) increased 2.3% m/m (seasonally adjusted) in August, as output in cement, petroleum refinery products and electricity picked up. However, steel, fertilizer and natural gas output moderated.
Bank credit as on 22nd September was 20% y/y, including the impact of the merger of a non-bank with a bank from 01 July 2023. Excluding this, credit growth had been moderated from late October 2022. Latest bank deposit growth is at 13.2% and has averaged 11.5% so far in 2023. Credit flow in FY23 was much higher than in the previous two financial years with strong flows to personal loans (38% of total flow) and services (33% of total flow). Credit flow so far in FY24 (Apr-August) has also been higher towards services and personal loans.
Merchandise trade deficit for August increased further to USD 24.2bn, after it had increased to USD 20.7bn in July. In August, oil exports were up by USD 1.3bn from July and non-oil exports were up by USD 0.9bn. However, oil imports were also up by USD 1.5bn, gold imports by USD 1.4bn and non-oil-non-gold imports by USD 2.8bn. Trade deficit, after peaking in September 2022 at USD 28bn, had moderated before the pickup from May 2023. However, services trade surplus surprised to the upside from late 2022 with an average monthly surplus of USD 13.4bn in H2 FY23 vs. USD10.4bn in H1 FY23. This was at USD 12.5bn in July and August and averaged USD 12.1bn in Q1 FY24.
India's Current Account Deficit (CAD) for the June 2023 quarter moved higher to 1.1% of GDP, from 0.2% in the March quarter. Overall BoP surplus increased to USD 24.4bn from USD 5.6bn. For FY23, India's CAD was 2% of GDP (1.2% in FY22) and the overall BoP balance was USD -9bn (USD +48bn in FY22).
Among higher-frequency variables, number of two-wheelers registered has improved since mid of August and energy consumption levels have averaged 12.6% y/y during the week ending 08 October 2023. Monthly number of GST e-way bills was strong at 9.2cr units in September and has averaged 9.1cr in the September quarter, after 8.6cr in the June quarter.
US headline CPI was at 3.7% y/y in August after 3.2% in July, with base effects also in play. In August, price momentum in energy goods picked back up strongly but that in used vehicles was negative again and that in rent of shelter moderated. Core CPI was at 4.3% in August after 4.7% in July. Sequential momentum in headline CPI, core CPI and non-housing-core-services moved up. US non-farm payroll addition in September (336,000 persons) was well above expectation. However, growth in average hourly earnings was below expectation (0.2% m/m) while the unemployment rate, employment-population ratio and labour force participation rate stayed flat. Non-farm job openings as per the Job Openings and Labor Turnover Survey (JOLTS) was also higher than expected and picked up for the first time after three months to 9.6mn in August from 8.9mn in July. The jobopening- to-hires ratio for the non-farm sector is now 1.64, off the peak of 1.83 in March 2022 but higher than the pre-pandemic average of 1.18 in Jan-Feb 2020.
The FOMC (Federal Open Market Committee), after raising the target range for the federal funds rate in ten consecutive meetings from March 2022 by a total of 500bps, paused at its June meeting and then hiked again by 25bps (to the 5.25-5.50% range) at its July meeting. It paused again at its September meeting, when it also revised up its projections for the federal funds rate for 2024 and 2025, implying fewer policy rate cuts than in June. It also revised up its real GDP forecasts and revised down its unemployment rate forecasts.
The October'23 monetary policy review was status quo on policy stance and rates, as was widely expected. However, there was a lot under the hood that was very hawkish indeed. Domestic growth remains resilient, with risks largely from uneven monsoons and the external side. On inflation, the unwind in the recent surge in vegetable prices as well as the relatively well-behaved core inflation trends were welcomed. The latter has softened by 140 bps since January to 4.9% now, even as the Governor noted further disinflation in the core component as being critical for price stability. Importantly, household inflation expectations are in single digits for the first time since the pandemic. Nevertheless, there are risks from certain food items on account of lower Kharif sowing, El Nino conditions, global food and energy prices, and from global financial market volatility. There was a reiteration that CPI target is 4% and not 2 - 6%.
What turned out to be unpalatable for the bond market is the Governor saying that RBI may resort to OMO bond sales for liquidity management if the need should arise. In the post policy conference, he further clarified that though there is no calendar being given for OMO sales, whenever it happens, it will done via the auction route. This is different from the OMO sales that RBI has lately been conducting via the NDS OM platform. The latter have been for smaller amounts and have not been market moving. However, explicit sales via the auction route are a different cup of tea. Also, while nothing has been announced thus far the Governor has effectively unleashed a long sword of uncertainty on the market's head. There are certain aspects of the evolution of RBI's liquidity framework that we assess below.
Our understanding has been that RBI's liquidity model was anchored around targetting weighted average call rate using the VRRR as the primary tool for liquidity management. Thus so long as this was being achieved the actual quantity of liquidity in the system wouldn't matter as much. The usage of the temporary ICRR tool undertaken in the previous policy seemed to stem from RBI's frustration that banks' offtake of 14 day VRRR seemed patchy. To be fair, though, there were explicit comments then about the potential damage that may arise from excess liquidity. Even so, the understanding mostly was that preference was for shorter term tools rather than permanent measures as far as liquidity is considered. Thus apart from VRRR, one was hearing about RBI conducting short tenor sell-buy swaps in dollar-rupee as well. The recent OMO sales via NDSOM screen had been quite modest.
However, the intention now to step OMO sales leads to some questions. One, why was the ICRR tool introduced with such an explicit guidance on its unwind? Why was it not kept open ended to be unwound as and when liquidity conditions permitted it? The reason we ask these is as follows: As per our estimates core system liquidity is of the order of INR 3,25,000 crores post the I-CRR unwind. However, currency in circulation is expected to rise by INR 225,000 - 250,000 crores by end of March 24, as per normal seasonal trends. Further, the balance of payment has been quite healthy over the first half of the year and is unlikely to be the same over the rest of the year. While this is speculative and difficult to model, but already RBI's dollar sales have picked up. The point we are making is that, in all likelihood there is no reason at all to take permanent measures on liquidity mop up given that most of the core liquidity surplus is already poised to vanish by the financial year end. The bother really is the time it takes for this to happen and that is why the temporary measures made perfect sense and the permanent measures (like OMO sales) don't. The other argument is that, despite denying it publicly, RBI actually wants yields to adjust higher, probably reflecting the rise in global bond yields. We are less inclined to go with this argument since at best it is a slippery slope to manage for the central bank.
The developments in the latest monetary policy is a near term challenge to our overweight position in 9 - 14 year bonds in our active duration funds. Our fundamental premise here was a more favorable demand - supply situation basis both the upcoming FPI inflows as well as due to the drop in net government bond supply starting this quarter. However, now RBI emerges a new supplier of government bonds. While there is no explicit calendar for this, as mentioned before a long sword hangs now that such OMOs can be announced any day. This is especially so since the market understands that the best of liquidity is likely over October - December quarter. Core liquidity may shrink enough by then (for reasons mentioned above) for RBI to not want to persist with OMOs from the next quarter. Thus the risk of this additional supply is more near term, and this may weigh more on the minds of market participants.
While the move is painful to our positioning, our view for now is to persist with the more medium term in mind. We list reasons below:
1. We provide below a summary of net government bond supply for the 4 quarters of the year:

As can be seen, even accounting for some OMO sales net supply for the rest of the year will still be substantially lower than for the first half of the year gone by. Thus we don't expect demand supply to be deeply out of skew unless the OMO sales are very large (not the base case).
2. We don't know the amount, frequency, or tenor distribution of the OMOs. If as an example, RBI chooses to focus more on very short tenor bonds then the market needn't have to worry as much eventually as it is worrying today. Put another way, the uncertainty regarding this announcement is at its highest currently and that is getting reflected in the free fall in bond prices at the time of writing.
3. This is more a macro positive and doesn't pertain as much to the immediate issue. One of the risks to the bond view we had mentioned earlier is that of substantial fiscal slippage. This was basis fiscal data till July 23. However, August data has seen a surge in tax revenues and has been a bit of a game changer. For contrast, below we present some cuts on year to date fiscal data till August vs till July.


As can be seen, the recovery is remarkable and substantially brings down the run rate required for the rest of the year. This substantially reduces the chances of any meaningful fiscal slippages.
Outlook
The risk so far one was contending with for a long bond view was chiefly from US yields. The potential OMO announcement has now introduced a local risk. Given that this was unanticipated and remains uncertain in contours, the reaction for the time being has been large from market participants. However, the underlying framework remains broadly the same. Eventually, the local trigger will likely count as a small blip in some sense. US bond yields are a more persistent variable to monitor in the near term but for reasons discussed before, we think it highly likely that these stabilize as well in the medium term. We continue with our overweight stance in 9 - 14 year government bonds in active duration bond and gilt funds. Short and medium duration funds continue overweight 3 - 6 year with overweight on government bonds vs corporate bonds wherever the mandate allows for it.
Source: Bandhan MF Research


