Bandhan Equity Savings Fund§
An open ended scheme investing in equity, arbitrage and debt

Bandhan Equity Savings Fund§
An open ended scheme investing in equity, arbitrage and debt
|
|
|
|
|

|


Category: Equity Savings
 : ₹ 99.54 Crores
AUM or assets under management refers to the recent / updated cumulative market value of investments managed by a mutual fund or any investment firm.
: ₹ 98.23 Crores
AUM or assets under management refers to the recent / updated cumulative market value of investments managed by a mutual fund or any investment firm.
:
An employee of the asset management company such as a mutual fund or life insurer, who manages investments of the scheme. He is usually part of a larger team of fund managers and research analysts.
Debt Portion: Mr. Harshal Joshi
Other Parameter:
| Beta
Beta is a measure of an investment's volatility vis-a-vis the market. Beta of less than 1 means that the security will be less volatile than the market. A beta of greater than 1 implies that the security's price will be more volatile than the market. | 0.59 |
| R Square | 0.88 |
| Standard Deviation (Annualized)
Standard deviation is a statistical measure of the range of an investment's performance. When a mutual fund has a high standard deviation, its means its range of performance is wide, implying greater volatility. | 2.99% |
| Sharpe*
The Sharpe Ratio, named after its founder, the Nobel Laureate William Sharpe, is a measure of risk-adjusted returns. It is calculated using standard deviation and excess return to determine reward per unit of risk. | 0.18 |
| Modified Duration₤
Modified duration is the price sensitivity and the percentage change in price for a unit change in yield | 392 Days |
| Average Maturity₤ | 449 Days |
| Macaulay Duration₤ | 420 Days |
| Yield to Maturity₤ | 7.58% |
| ₤For debt allocation only | |
| Portfolio Turnover | |
| Equity | 0.24 |
| Aggregate^ | 6.97 |
| Total Expense Ratio | |
| Regular | 1.36% |
| Direct | 0.38% |
SIP (Minimum Amount): ₹ 100/- (Minimum 6 instalments)
SIP Frequency: Monthly/Quarterly (w.e.f. 09-11-2022)
SIP Dates (Monthly/Quarterly)@@: Investor may choose any day of the month except 29th, 30th and 31st as the date of installment.
Investment Objective: Click here
Minimum Investment Amount : ₹ 1,000/- and any amount thereafter
Option Available: Growth & IDCW@ Option - Monthly, Quarterly and Annual and Payout, Reinvestment & Sweep facilities (from Equity Schemes to Debt Schemes Only).
:
Exit load is charged at the time an investor redeems the units of a mutual fund. The exit load is deducted from the prevailing NAV at the time of redemption. For instance, if the NAV is ₹ 100 and the exit load is 1%, the redemption price would be ₹ 99 per unit.
› Up to 10% of investment: Nil,
› For remaining investment: 0.25% of applicable NAV.
• If redeemed/switched out after 7 days from date of allotment: Nil.
NAV (₹) as on January 31, 2024
| Regular Plan | Growth | 28.0860 |
| Regular Plan | Monthly IDCW@ | 14.6050 |
| Regular Plan | Annual IDCW@ | 13.1030 |
| Regular Plan | Quarterly IDCW@ | 12.7220 |
@Income Distribution and Capital Withdrawal
@@If SIP day falls on a non-business day, the SIP transaction shall be processed on the next business day.
| Name | Industries | % of NAV |
| Equity and Equity related Instruments | 70.40% | |
| Net Equity Exposure | 21.89% | |
| Banks | 6.39% | |
| oHDFC Bank | 3.23% | |
| HDFC Bank - Equity Futures | -0.66% | |
| oICICI Bank | 3.23% | |
| ICICI Bank - Equity Futures | -1.55% | |
| Axis Bank | 0.70% | |
| Kotak Mahindra Bank | 0.63% | |
| State Bank of India | 0.57% | |
| IndusInd Bank | 0.24% | |
| IT - Software | 3.13% | |
| oTata Consultancy Services | 4.44% | |
| Tata Consultancy Services - Equity Futures | -3.55% | |
| oHCL Technologies | 3.09% | |
| HCL Technologies - Equity Futures | -2.71% | |
| Infosys | 1.40% | |
| Tech Mahindra | 1.17% | |
| Tech Mahindra - Equity Futures | -0.98% | |
| Wipro | 0.16% | |
| LTIMindtree | 0.12% | |
| Petroleum Products | 2.35% | |
| oReliance Industries | 4.80% | |
| Reliance Industries - Equity Futures | -2.56% | |
| Bharat Petroleum Corporation | 0.11% | |
| Automobiles | 1.49% | |
| Tata Motors | 2.81% | |
| Tata Motors - Equity Futures | -2.44% | |
| Mahindra & Mahindra | 1.76% | |
| Mahindra & Mahindra - Equity Futures | -1.42% | |
| Maruti Suzuki India | 0.32% | |
| Bajaj Auto | 0.20% | |
| Hero MotoCorp | 0.14% | |
| Eicher Motors | 0.12% | |
| Diversified FMCG | 1.44% | |
| ITC | 0.92% | |
| Hindustan Unilever | 0.52% | |
| Construction | 0.96% | |
| Larsen & Toubro | 2.13% | |
| Larsen & Toubro - Equity Futures | -1.17% | |
| Pharmaceuticals & Biotechnology | 0.81% | |
| oAurobindo Pharma | 5.15% | |
| Aurobindo Pharma - Equity Futures | -5.16% | |
| oSun Pharmaceutical Industries | 3.70% | |
| Sun Pharmaceutical Industries - Equity Futures | -3.33% | |
| Torrent Pharmaceuticals | 2.58% | |
| Torrent Pharmaceuticals - Equity Futures | -2.57% | |
| Dr. Reddy's Laboratories | 0.17% | |
| Cipla | 0.17% | |
| Divi's Laboratories | 0.11% | |
| Telecom - Services | 0.69% | |
| Bharti Airtel | 0.69% | |
| Consumer Durables | 0.67% | |
| Titan Company | 0.36% | |
| Asian Paints | 0.31% | |
| Finance | 0.64% | |
| oBajaj Finance | 3.95% | |
| Name | Industries | % of NAV |
| Bajaj Finance - Equity Futures | -3.52% | |
| Bajaj Finserv | 0.21% | |
| Power | 0.60% | |
| oTata Power Company | 5.09% | |
| Tata Power Company - Equity Futures | -5.13% | |
| NTPC | 0.36% | |
| Power Grid Corporation of India | 0.28% | |
| Cement & Cement Products | 0.46% | |
| UltraTech Cement | 0.28% | |
| Grasim Industries | 0.19% | |
| Ferrous Metals | 0.44% | |
| JSW Steel | 1.76% | |
| Tata Steel | 0.26% | |
| JSW Steel - Equity Futures | -1.58% | |
| Food Products | 0.36% | |
| Nestle India | 0.21% | |
| Britannia Industries | 0.14% | |
| Insurance | 0.28% | |
| SBI Life Insurance Company | 1.00% | |
| SBI Life Insurance Company - Equity Futures | -0.86% | |
| HDFC Life Insurance Company | 0.14% | |
| Oil | 0.23% | |
| Oil & Natural Gas Corporation | 0.23% | |
| Consumable Fuels | 0.22% | |
| Coal India | 0.22% | |
| Transport Infrastructure | 0.21% | |
| Adani Ports and Special Economic Zone | 0.21% | |
| Non - Ferrous Metals | 0.20% | |
| Hindalco Industries | 0.20% | |
| Healthcare Services | 0.15% | |
| Apollo Hospitals Enterprise | 0.15% | |
| Agricultural Food & other Products | 0.14% | |
| Marico | 2.90% | |
| Marico - Equity Futures | -2.92% | |
| Tata Consumer Products | 0.16% | |
| Fertilizers & Agrochemicals | 0.06% | |
| UPL | 0.06% | |
| Chemicals & Petrochemicals | -0.02% | |
| oPidilite Industries | 3.61% | |
| Pidilite Industries - Equity Futures | -3.63% | |
| Personal Products | -0.02% | |
| Dabur India | 2.75% | |
| Dabur India - Equity Futures | -2.77% | |
| Corporate Bond | 15.16% | |
| Power Finance Corporation | AAA | 5.07% |
| NABARD | AAA | 5.06% |
| Kotak Mahindra Prime | AAA | 5.03% |
| Britannia Industries | AAA | 0.0002% |
| Government Bond | 1.23% | |
| 7.38% - 2027 G-Sec | SOV | 1.23% |
| Mutual Fund Units | 9.18% | |
| Bandhan Liquid Fund -Direct Plan-Growth | 9.18% | |
| Net Cash and Cash Equivalent | 4.03% | |
| Grand Total | 100.00% | |
| oTop 10 Equity Holdings |
| Pharmaceuticals & Biotechnology | 11.88% |
| IT - Software | 10.37% |
| Banks | 8.60% |
| Power | 5.72% |
| Automobiles | 5.35% |
| Petroleum Products | 4.91% |
| Finance | 4.16% |
| Chemicals & Petrochemicals | 3.61% |
| Agricultural Food & other Products | 3.06% |
| Personal Products | 2.75% |
| Construction | 2.13% |
| Ferrous Metals | 2.02% |
| Diversified FMCG | 1.44% |
| Insurance | 1.15% |
| Telecom - Services | 0.69% |
| Consumer Durables | 0.67% |
| Cement & Cement Products | 0.46% |
| Food Products | 0.36% |
| Oil | 0.23% |
| Consumable Fuels | 0.22% |
| Transport Infrastructure | 0.21% |
| Non - Ferrous Metals | 0.20% |
| Healthcare Services | 0.15% |
| Fertilizers & Agrochemicals | 0.06% |
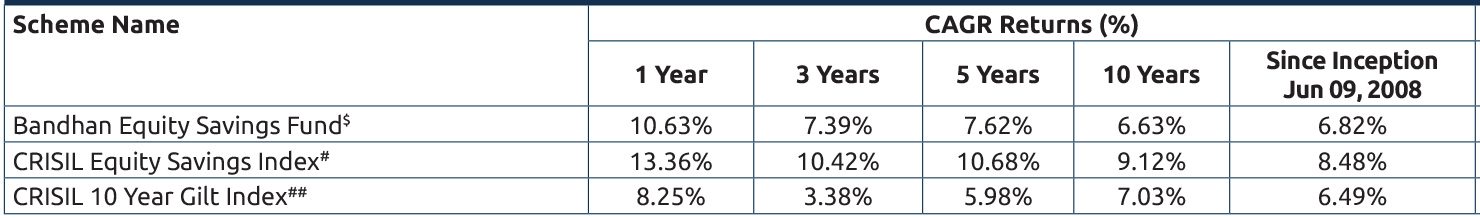
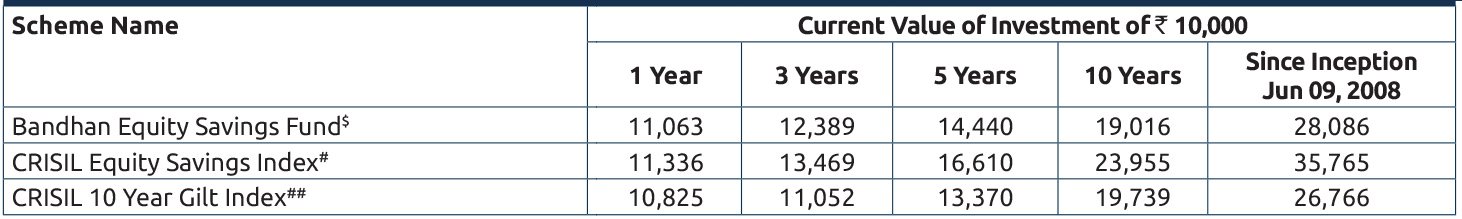
Performance based on NAV as on 31/01/2024. Past performance may or may not be sustained in future.
The performances given are of regular plan growth option.
Click here for other funds managed by the fund manager and refer to the respective fund pages
#Benchmark Returns. ##Alternate Benchmark Returns.
Scheme risk-o-meter
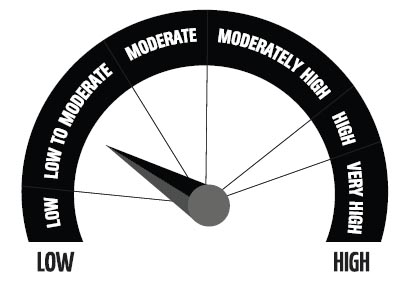
Investors understand that their principal will be at Low to Moderate risk
This product is suitable for investors who are seeking*
- To generate long term capital growth and income.
- Investment predominantly in Equity and Equity related securities (including arbitrage and other derivative strategies) as well as Fixed Income securities.
* Investors should consult their financial advisers if in doubt about whether the product is suitable for them.
Benchmark risk-o-meter
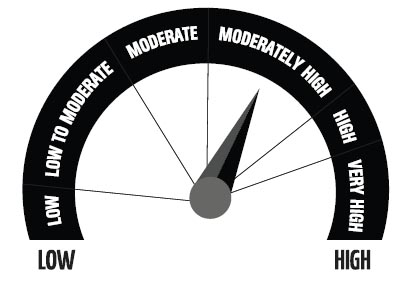
CRISIL Equity Savings Index
Regular and Direct Plans have different expense structure. Direct Plan shall have a lower expense ratio excluding distribution expenses, commission expenses etc.
*Risk-free rate assumed to be 6.85% (FBIL OVERNIGHT MIBOR as on 31st January 2024). Ratios calculated on the basis of 3 years history of monthly data.
^Portfolio Turnover ratio is calculated as Lower of purchase or sale during the period / Average AUM for the last one year (includes Fixed Income securities and Equity derivatives).
$The fund has been repositioned from an arbitrage fund to an equity savings fund w.e.f. April 30, 2018.
Current Index performance adjusted for the period from since inception to April 30, 2018 with the performance of CRISIL Liquid Fund Index (Benchmark)
Dedicated fund manager for foreign / overseas investment has been changed from Mr. Viraj Kulkarni to Ms. Ritika Behera.
§With effect from 13th March 2023, the name of "IDFC Equity Savings Fund" has changed to "Bandhan Equity Savings Fund"
Ms. Ritika Behera has been designated as the dedicated fund manager for managing the overseas exposure in equity segment for all equity oriented schemes and hybrid schemes of Bandhan Mutual Fund ("the Fund") with effect from October 07, 2023.
Mr. Sachin Relekar managed this scheme till 23rd January 2024.
