Bandhan Flexi Cap Fund§
An open ended dynamic equity scheme investing across large cap, mid cap, small cap stocks

Bandhan Flexi Cap Fund§
An open ended dynamic equity scheme investing across large cap, mid cap, small cap stocks
|
|
|
|
|

|


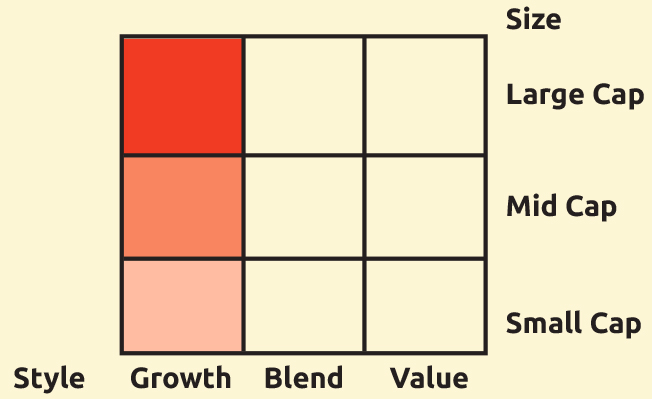
About the Fund: Bandhan Flexi Cap Fund is a market capitalization agnostic portfolio investing across large, mid, and small cap segments. It focuses on long-term wealth creation through 'Buy & Hold' and 'Active Management' strategies.
Category: Flexicap
 : ₹ 6,672.50 Crores
AUM or assets under management refers to the recent / updated cumulative market value of investments managed by a mutual fund or any investment firm.
: ₹ 6,712.51 Crores
AUM or assets under management refers to the recent / updated cumulative market value of investments managed by a mutual fund or any investment firm.
:
An employee of the asset management company such as a mutual fund or life insurer, who manages investments of the scheme. He is usually part of a larger team of fund managers and research analysts.
Other Parameter:
| Beta
Beta is a measure of an investment's volatility vis-a-vis the market. Beta of less than 1 means that the security will be less volatile than the market. A beta of greater than 1 implies that the security's price will be more volatile than the market. | 0.85 |
| R Square | 0.86 |
| Standard Deviation (Annualized)
Standard deviation is a statistical measure of the range of an investment's performance. When a mutual fund has a high standard deviation, its means its range of performance is wide, implying greater volatility. | 12.54% |
| Sharpe*
The Sharpe Ratio, named after its founder, the Nobel Laureate William Sharpe, is a measure of risk-adjusted returns. It is calculated using standard deviation and excess return to determine reward per unit of risk. | 0.90 |
| Portfolio Turnover | |
| Equity | 0.43 |
| Aggregate^ | 0.43 |
| Total Expense Ratio | |
| Regular | 1.87% |
| Direct | 1.15% |
SIP (Minimum Amount): ₹ 100/- (Minimum 6 instalments)
SIP Frequency: Monthly/Quarterly (w.e.f. 09-11-2022)
SIP Dates (Monthly/Quarterly)@@: Investor may choose any day of the month except 29th, 30th and 31st as the date of installment.
Investment Objective: Click here
Minimum Investment Amount : ₹ 1,000/- and any amount thereafter
(Units of Bandhan Flexi Cap Fund, shall be available for lump sum subscription w.e.f. May 07, 2018)
Option Available: Growth, IDCW $ - (Payout, Reinvestment and Sweep (from Equity Schemes to Debt Schemes only))
:
Exit load is charged at the time an investor redeems the units of a mutual fund. The exit load is deducted from the prevailing NAV at the time of redemption. For instance, if the NAV is ₹ 100 and the exit load is 1%, the redemption price would be ₹ 99 per unit.
from the date of allotment:
► Upto 10% of investment:Nil,
► For remaining investment: 1% of applicable NAV.
• If redeemed / switched out after 365 days from date
of allotment: Nil. (w.e.f. May 08, 2020)
NAV (₹) as on January 31, 2024
| Regular Plan | Growth | 172.93 |
| Regular Plan | IDCW$ | 47.77 |
@@If SIP day falls on a non-business day, the SIP transaction shall be processed on the next business day.
^^Ms. Ritika Behera will be managing for Equity overseas investment portion of the scheme w.e.f. October 07, 2023.
| Name | % of NAV | |
| Equity and Equity related Instruments | 96.35% | |
| Banks | 17.86% | |
| oICICI Bank | 8.15% | |
| oHDFC Bank | 5.38% | |
| oAxis Bank | 3.23% | |
| Kotak Mahindra Bank | 0.54% | |
| IDFC First Bank | 0.36% | |
| IndusInd Bank | 0.21% | |
| IT - Software | 9.32% | |
| oInfosys | 5.04% | |
| Tata Consultancy Services | 2.02% | |
| MphasiS | 1.05% | |
| Coforge | 0.60% | |
| KPIT Technologies | 0.60% | |
| Industrial Products | 6.24% | |
| Kirloskar Pneumatic Company | 1.59% | |
| Supreme Industries | 1.33% | |
| Cummins India | 1.18% | |
| APL Apollo Tubes | 1.17% | |
| Timken India | 0.50% | |
| Carborundum Universal | 0.46% | |
| Automobiles | 5.44% | |
| Tata Motors | 2.41% | |
| Mahindra & Mahindra | 1.78% | |
| TVS Motor Company | 1.24% | |
| Auto Components | 5.36% | |
| oUNO Minda | 2.60% | |
| Sona BLW Precision Forgings | 1.51% | |
| Schaeffler India | 0.74% | |
| Samvardhana Motherson International | 0.52% | |
| Retailing | 4.78% | |
| Avenue Supermarts | 1.90% | |
| Trent | 1.42% | |
| Zomato | 1.00% | |
| Aditya Birla Fashion and Retail | 0.46% | |
| Petroleum Products | 4.46% | |
| oReliance Industries | 4.46% | |
| Finance | 3.72% | |
| oBajaj Finance | 2.67% | |
| Cholamandalam Invt and Fin Co | 1.05% | |
| Electrical Equipment | 3.71% | |
| Apar Industries | 1.88% | |
| Suzlon Energy | 1.27% | |
| CG Power and Industrial Solutions | 0.56% | |
| Construction | 3.33% | |
| oLarsen & Toubro | 3.33% | |
| Chemicals & Petrochemicals | 2.63% | |
| Fine Organic Industries | 1.37% | |
| SRF | 0.76% | |
| Aether Industries | 0.50% | |
| Telecom - Services | 2.54% |
| Name | % of NAV | |
| oBharti Airtel | 2.54% | |
| Diversified FMCG | 2.48% | |
| ITC | 1.89% | |
| Hindustan Unilever | 0.59% | |
| Pharmaceuticals & Biotechnology | 2.42% | |
| Sun Pharmaceutical Industries | 1.11% | |
| Cipla | 1.05% | |
| Mankind Pharma | 0.26% | |
| Beverages | 2.41% | |
| oVarun Beverages | 2.41% | |
| Industrial Manufacturing | 2.22% | |
| Titagarh Rail Systems | 0.97% | |
| Praj Industries | 0.93% | |
| Kaynes Technology India | 0.32% | |
| Healthcare Services | 2.08% | |
| Apollo Hospitals Enterprise | 1.19% | |
| Narayana Hrudayalaya | 0.50% | |
| Krishna Institute of Medical Sciences | 0.39% | |
| Consumer Durables | 1.91% | |
| Titan Company | 1.91% | |
| Diversified | 1.89% | |
| 3M India | 1.89% | |
| Transport Services | 1.72% | |
| InterGlobe Aviation | 1.72% | |
| Cement & Cement Products | 1.67% | |
| UltraTech Cement | 1.59% | |
| JK Lakshmi Cement | 0.07% | |
| Realty | 1.35% | |
| SignatureGlobal (India) | 1.28% | |
| Macrotech Developers | 0.07% | |
| Aerospace & Defense | 1.32% | |
| Bharat Electronics | 1.28% | |
| MTAR Technologies | 0.04% | |
| Power | 1.11% | |
| NTPC | 1.11% | |
| Food Products | 1.10% | |
| Mrs. Bectors Food Specialities | 1.10% | |
| Non - Ferrous Metals | 1.07% | |
| Hindalco Industries | 1.07% | |
| Ferrous Metals | 1.01% | |
| Tata Steel | 1.01% | |
| Insurance | 0.93% | |
| SBI Life Insurance Company | 0.93% | |
| Capital Markets | 0.27% | |
| Motilal Oswal Financial Services | 0.27% | |
| Corporate Bond | 0.01% | |
| Britannia Industries | AAA | 0.01% |
| Net Cash and Cash Equivalent | 3.65% | |
| Grand Total | 100.00% | |
oTop 10 Equity Holdings |
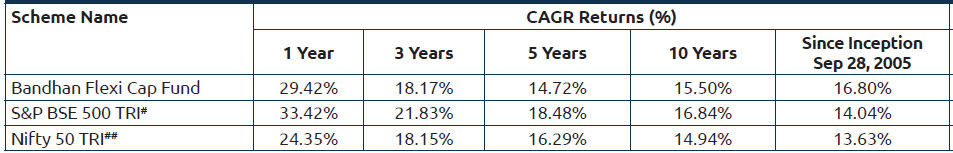
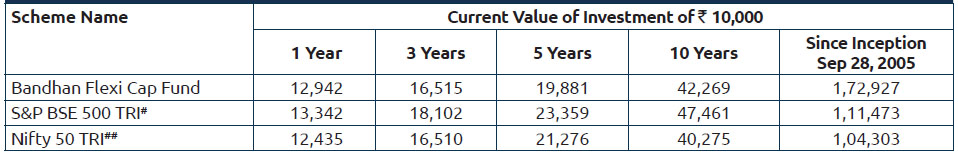
Performance based on NAV as on 31/01/2024. Past performance may or may not be sustained in future.
The performances given are of regular plan growth option.
Click here for other funds managed by the fund manager and refer to the respective fund pages
#Benchmark Returns. ##Alternate Benchmark Returns.
Scheme risk-o-meter
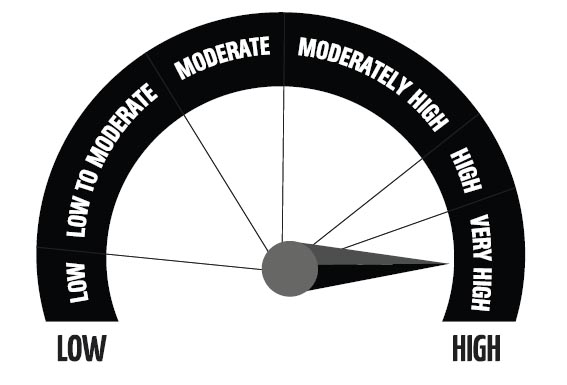
Investors understand that their principal will be at Very High risk
This product is suitable for investors who are seeking*
- To create wealth over long term.
- Investment predominantly in equity and equity related instruments across market capitalisation.
* Investors should consult their financial advisers if in doubt about whether the product is suitable for them.
Benchmark risk-o-meter
S&P BSE 500 TRI
Regular and Direct Plans have different expense structure. Direct Plan shall have a lower expense ratio excluding distribution expenses, commission expenses etc.
*Risk-free rate assumed to be 6.85% (FBIL OVERNIGHT MIBOR as on 31st January 2024). Ratios calculated on the basis of 3 years history of monthly data.
^Portfolio Turnover ratio is calculated as Lower of purchase or sale during the period / Average AUM for the last one year (includes Fixed Income securities and Equity derivatives).
Current Index performance adjusted for the period from since inception to June 28, 2007 with the performance of S&P BSE 500 price return index (Benchmark)
§With effect from 13th March 2023, the name of "IDFC Flexi Cap Fund" has changed to "Bandhan Flexi Cap Fund"
Ms. Ritika Behera has been designated as the dedicated fund manager for managing the overseas exposure in equity segment for all equity oriented schemes and hybrid schemes of Bandhan Mutual Fund ("the Fund") with effect from October 07, 2023.Mr. Sachin Relekar managed this scheme till 23rd January 2024
