Bandhan Nifty 100 Index Fund§
An open-ended scheme tracking Nifty 100 Index

Bandhan Nifty 100 Index Fund§
An open-ended scheme tracking Nifty 100 Index
|
|
|
|
|

|


Category: Index Fund
 : ₹ 103.90 Crores
AUM or assets under management refers to the recent / updated cumulative market value of investments managed by a mutual fund or any investment firm.
: ₹ 105.64 Crores
AUM or assets under management refers to the recent / updated cumulative market value of investments managed by a mutual fund or any investment firm.
:
An employee of the asset management company such as a mutual fund or life insurer, who manages investments of the scheme. He is usually part of a larger team of fund managers and research analysts.
| Portfolio Turnover Ratio | |
| Equity | 0.12 |
| Aggregate^ | 0.12 |
| Total Expense Ratio | |
| Regular | 0.61% |
| Direct | 0.09% |
SIP (Minimum Amount): ₹ 100/- and in multiples of Re. 1 thereafter
SIP Frequency: Monthly/Quarterly (w.e.f. 09-11-2022)
SIP Dates (Monthly/Quarterly)@@: Investor may choose any day of the month except 29th, 30th and 31st as the date of instalment.
Investment Objective: Click here
Minimum Investment Amount : ₹ 1,000/- in multiples of Re. 1/- thereafter
Option Available: Growth, IDCW@ - (Payout, Reinvestment and Sweep (from Equity Schemes to Debt Schemes only))
:
Exit load is charged at the time an investor redeems the units of a mutual fund. The exit load is deducted from the prevailing NAV at the time of redemption. For instance, if the NAV is ₹ 100 and the exit load is 1%, the redemption price would be ₹ 99 per unit.
NAV (₹) as on January 31, 2024
| Regular Plan | Growth | 12.80 |
| Regular Plan | IDCW@ | 12.80 |
@@If SIP day falls on a non-business day, the SIP transaction shall be processed on the next business day.
Portfolio Beta, Standard Deviation, R Squared, Sharpe Ratio and Tracking Error of the Scheme is not computed owing to the short time frame (<3years) since launch of the Scheme
| Name | % of NAV |
| Equity and Equity related Instruments | 99.83% |
| Banks | 24.86% |
| oHDFC Bank | 9.60% |
| oICICI Bank | 6.30% |
| oAxis Bank | 2.59% |
| oKotak Mahindra Bank | 2.35% |
| State Bank of India | 2.15% |
| IndusInd Bank | 0.89% |
| Bank of Baroda | 0.40% |
| Punjab National Bank | 0.30% |
| Canara Bank | 0.28% |
| IT - Software | 11.77% |
| oInfosys | 5.18% |
| oTata Consultancy Services | 3.38% |
| HCL Technologies | 1.46% |
| Tech Mahindra | 0.73% |
| Wipro | 0.59% |
| LTIMindtree | 0.44% |
| Petroleum Products | 9.32% |
| oReliance Industries | 8.43% |
| Indian Oil Corporation | 0.47% |
| Bharat Petroleum Corporation | 0.42% |
| Automobiles | 6.22% |
| Tata Motors | 1.60% |
| Mahindra & Mahindra | 1.29% |
| Maruti Suzuki India | 1.18% |
| Bajaj Auto | 0.76% |
| Hero MotoCorp | 0.52% |
| Eicher Motors | 0.46% |
| TVS Motor Company | 0.41% |
| Diversified FMCG | 5.35% |
| oITC | 3.42% |
| Hindustan Unilever | 1.94% |
| Finance | 4.09% |
| Bajaj Finance | 1.67% |
| Bajaj Finserv | 0.77% |
| Shriram Finance | 0.60% |
| Cholamandalam Invt and Fin Co | 0.42% |
| Bajaj Holdings & Investment | 0.32% |
| SBI Cards and Payment Services | 0.18% |
| Muthoot Finance | 0.13% |
| Power | 3.74% |
| NTPC | 1.32% |
| Power Grid Corporation of India | 1.03% |
| Tata Power Company | 0.58% |
| Adani Green Energy | 0.53% |
| Adani Energy Solutions | 0.28% |
| Construction | 3.59% |
| oLarsen & Toubro | 3.59% |
| Pharmaceuticals & Biotechnology | 3.39% |
| Sun Pharmaceutical Industries | 1.34% |
| Dr. Reddy's Laboratories | 0.65% |
| Cipla | 0.62% |
| Divi's Laboratories | 0.41% |
| Torrent Pharmaceuticals | 0.20% |
| Zydus Lifesciences | 0.17% |
| Consumer Durables | 2.94% |
| Titan Company | 1.35% |
| Asian Paints | 1.17% |
| Havells India | 0.28% |
| Berger Paints (I) | 0.14% |
| Telecom - Services | 2.59% |
| oBharti Airtel | 2.59% |
| Cement & Cement Products | 2.42% |
| UltraTech Cement | 1.03% |
| Grasim Industries | 0.70% |
| Ambuja Cements | 0.36% |
| Shree Cement | 0.33% |
| Retailing | 2.08% |
| Zomato | 0.65% |
| Name | % of NAV |
| Trent | 0.59% |
| Avenue Supermarts | 0.50% |
| Info Edge (India) | 0.34% |
| Ferrous Metals | 1.90% |
| Tata Steel | 0.97% |
| JSW Steel | 0.68% |
| Jindal Steel & Power | 0.24% |
| Insurance | 1.80% |
| SBI Life Insurance Company | 0.55% |
| HDFC Life Insurance Company | 0.53% |
| ICICI Lombard General Insurance Company | 0.33% |
| Life Insurance Corporation of India | 0.21% |
| ICICI Prudential Life Insurance Company | 0.17% |
| Food Products | 1.32% |
| Nestle India | 0.78% |
| Britannia Industries | 0.54% |
| Personal Products | 1.10% |
| Godrej Consumer Products | 0.39% |
| Colgate Palmolive (India) | 0.30% |
| Dabur India | 0.28% |
| Procter & Gamble Hygiene and Health Care | 0.14% |
| Aerospace & Defense | 1.07% |
| Bharat Electronics | 0.58% |
| Hindustan Aeronautics | 0.49% |
| Agricultural Food & other Products | 0.90% |
| Tata Consumer Products | 0.61% |
| Marico | 0.24% |
| Adani Wilmar | 0.05% |
| Oil | 0.86% |
| Oil & Natural Gas Corporation | 0.86% |
| Beverages | 0.82% |
| Varun Beverages | 0.54% |
| United Spirits | 0.28% |
| Consumable Fuels | 0.81% |
| Coal India | 0.81% |
| Transport Infrastructure | 0.78% |
| Adani Ports and Special Economic Zone | 0.78% |
| Non - Ferrous Metals | 0.74% |
| Hindalco Industries | 0.74% |
| Metals & Minerals Trading | 0.72% |
| Adani Enterprises | 0.72% |
| Gas | 0.65% |
| GAIL (India) | 0.41% |
| Adani Total Gas | 0.24% |
| Chemicals & Petrochemicals | 0.63% |
| Pidilite Industries | 0.34% |
| SRF | 0.30% |
| Healthcare Services | 0.56% |
| Apollo Hospitals Enterprise | 0.56% |
| Electrical Equipment | 0.54% |
| Siemens | 0.32% |
| ABB India | 0.22% |
| Fertilizers & Agrochemicals | 0.47% |
| PI Industries | 0.24% |
| UPL | 0.24% |
| Realty | 0.45% |
| DLF | 0.45% |
| Auto Components | 0.41% |
| Samvardhana Motherson International | 0.23% |
| Bosch | 0.18% |
| Transport Services | 0.37% |
| InterGlobe Aviation | 0.37% |
| Diversified Metals | 0.32% |
| Vedanta | 0.32% |
| Leisure Services | 0.26% |
| Indian Railway Catering And Tourism Corporation | 0.26% |
| Net Cash and Cash Equivalent | 0.17% |
| Grand Total | 100.00% |
| oTop 10 Equity Holdings |
| Banks | 24.86% |
| IT - Software | 11.77% |
| Petroleum Products | 9.32% |
| Automobiles | 6.22% |
| Diversified FMCG | 5.35% |
| Finance | 4.09% |
| Power | 3.74% |
| Construction | 3.59% |
| Pharmaceuticals & Biotechnology | 3.39% |
| Consumer Durables | 2.94% |
| Telecom - Services | 2.59% |
| Cement & Cement Products | 2.42% |
| Retailing | 2.08% |
| Ferrous Metals | 1.90% |
| Insurance | 1.80% |
| Food Products | 1.32% |
| Personal Products | 1.10% |
| Aerospace & Defense | 1.07% |
| Agricultural Food & other Products | 0.90% |
| Oil | 0.86% |
| Beverages | 0.82% |
| Consumable Fuels | 0.81% |
| Transport Infrastructure | 0.78% |
| Non - Ferrous Metals | 0.74% |
| Metals & Minerals Trading | 0.72% |
| Gas | 0.65% |
| Chemicals & Petrochemicals | 0.63% |
| Healthcare Services | 0.56% |
| Electrical Equipment | 0.54% |
| Fertilizers & Agrochemicals | 0.47% |
| Realty | 0.45% |
| Auto Components | 0.41% |
| Transport Services | 0.37% |
| Diversified Metals | 0.32% |
| Leisure Services | 0.26% |
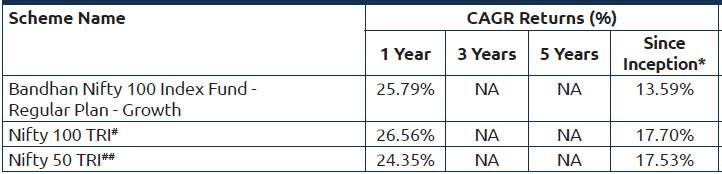
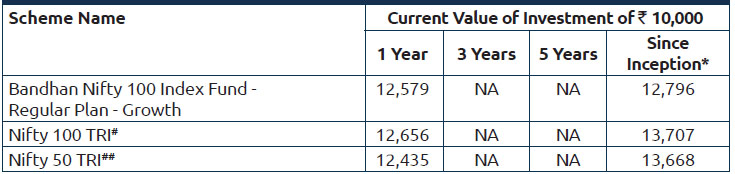
The scheme has been in existence for more than 1 year but less than 3 years or 5 years.
Performance based on NAV as on 31/01/2024. Past performance may or may not be sustained in future.
#Benchmark Returns. ##Alternate Benchmark Returns.
Click here for other funds managed by the fund manager and refer to the respective fund pages
Scheme risk-o-meter
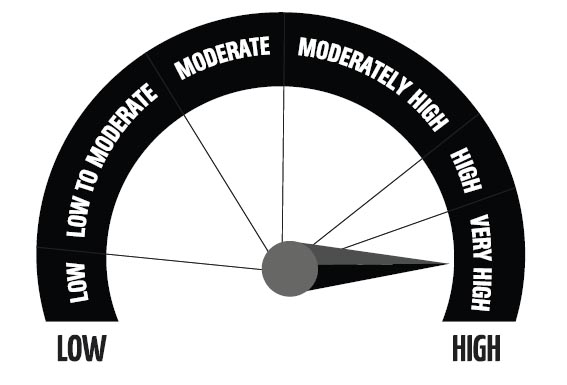
Investors understand that their principal will be at Very High risk
This product is suitable for investors who are seeking*
- To create wealth over long term.
- Investment in equity and equity related instruments belonging to Nifty 100 Index.
* Investors should consult their financial advisers if in doubt about whether the product is suitable for them.
Benchmark risk-o-meter
Nifty 100 TRI
Regular and Direct Plans have different expense structure. Direct Plan shall have a lower expense ratio excluding distribution expenses, commission expenses etc.
*Inception Date of Regular Plan - Growth February 24, 2022.
^Portfolio Turnover ratio is calculated as Lower of purchase or sale during the period / Average AUM for the last one year (includes Fixed Income securities and Equity derivatives).
§With effect from 13th March 2023, the name of "IDFC Nifty 100 Index Fund" has changed to "Bandhan Nifty 100 Index Fund"
