Bandhan S&P BSE Sensex ETF§(BSE scrip code: 540154)
An open ended scheme tracking S&P BSE Sensex Index

Bandhan S&P BSE Sensex ETF§ (BSE scrip code: 540154)
An open ended scheme tracking S&P BSE Sensex Index
|
|
|
|
|

|


Category: Exchange Traded Fund
 : ₹ 1.07 Crores
AUM or assets under management refers to the recent / updated cumulative market value of investments managed by a mutual fund or any investment firm.
: ₹ 1.08 Crores
AUM or assets under management refers to the recent / updated cumulative market value of investments managed by a mutual fund or any investment firm.
:
An employee of the asset management company such as a mutual fund or life insurer, who manages investments of the scheme. He is usually part of a larger team of fund managers and research analysts.
Other Parameter:
| Beta | 0.99 |
| R Square | 1.00 |
| Standard Deviation (Annualized) | 13.09% |
| Sharpe* | 0.74 |
| Portfolio Turnover | |
| Equity | 0.07 |
| Aggregate^ | 0.07 |
| Tracking Error(Annualized) | 0.18% | Total Expense Ratio : | 0.33% |
SIP (Minimum Amount): NA
SIP Frequency: NA
SIP Dates (Monthly): NA
Investment Objective: Click here
:
Exit load is charged at the time an investor redeems the units of a mutual fund. The exit load is deducted from the prevailing NAV at the time of redemption. For instance, if the NAV is ₹ 100 and the exit load is 1%, the redemption price would be ₹ 99 per unit.
NAV (₹) as on January 31, 2024
| Growth | 764.0571 |
| IDCW@ | NA |
Tracking error calculated on the basis of 3 years history of daily data.
| Name | % of NAV |
| Equity and Equity related Instruments | 99.77% |
| Banks | 33.30% |
| oHDFC Bank | 13.48% |
| oICICI Bank | 8.71% |
| oAxis Bank | 3.72% |
| oKotak Mahindra Bank | 3.17% |
| State Bank of India | 3.02% |
| IndusInd Bank | 1.20% |
| IT - Software | 15.58% |
| oInfosys | 7.08% |
| oTata Consultancy Services | 4.72% |
| HCL Technologies | 1.99% |
| Tech Mahindra | 0.99% |
| Wipro | 0.80% |
| Petroleum Products | 12.01% |
| oReliance Industries | 12.01% |
| Diversified FMCG | 7.50% |
| oITC | 4.78% |
| Hindustan Unilever | 2.72% |
| Automobiles | 5.57% |
| Tata Motors | 1.96% |
| Mahindra & Mahindra | 1.91% |
| Maruti Suzuki India | 1.70% |
| Construction | 5.14% |
| oLarsen & Toubro | 5.14% |
| Name | % of NAV |
| Telecom - Services | 3.61% |
| oBharti Airtel | 3.61% |
| Consumer Durables | 3.57% |
| Titan Company | 1.92% |
| Asian Paints | 1.65% |
| Finance | 3.36% |
| Bajaj Finance | 2.30% |
| Bajaj Finserv | 1.06% |
| Power | 3.34% |
| NTPC | 1.85% |
| Power Grid Corporation of India | 1.49% |
| Ferrous Metals | 2.31% |
| Tata Steel | 1.35% |
| JSW Steel | 0.96% |
| Pharmaceuticals & Biotechnology | 1.90% |
| Sun Pharmaceutical Industries | 1.90% |
| Cement & Cement Products | 1.42% |
| UltraTech Cement | 1.42% |
| Food Products | 1.16% |
| Nestle India | 1.16% |
| Net Cash and Cash Equivalent | 0.23% |
| Grand Total | 100.00% |
| oTop 10 Equity Holdings |
| Banks | 33.30% |
| IT - Software | 15.58% |
| Petroleum Products | 12.01% |
| Diversified FMCG | 7.50% |
| Automobiles | 5.57% |
| Construction | 5.14% |
| Telecom - Services | 3.61% |
| Consumer Durables | 3.57% |
| Finance | 3.36% |
| Power | 3.34% |
| Ferrous Metals | 2.31% |
| Pharmaceuticals & Biotechnology | 1.90% |
| Cement & Cement Products | 1.42% |
| Food Products | 1.16% |
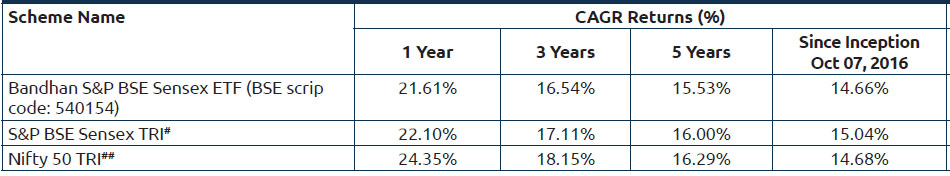
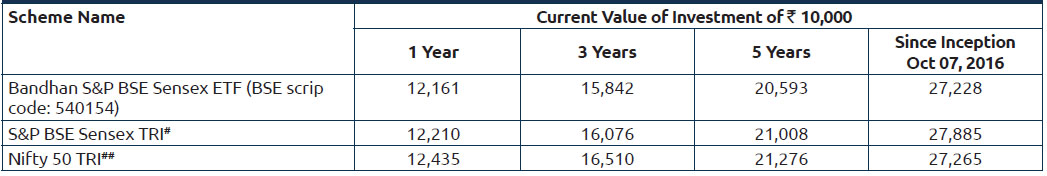
Performance based on NAV as on 31/01/2024. Past performance may or may not be sustained in future.
Click here for other funds managed by the fund manager and refer to the respective fund pages
#Benchmark Returns. ##Alternate Benchmark Returns.
Scheme risk-o-meter
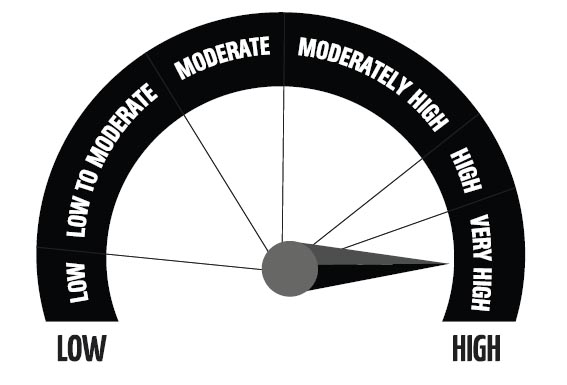
Investors understand that their principal will be at Very High risk
This product is suitable for investors who are seeking*
- To create wealth over long term.
- Investing in equity and equity related instruments forming part of S&P BSE Sensex Index.
* Investors should consult their financial advisers if in doubt about whether the product is suitable for them.
Benchmark risk-o-meter
S&P BSE Sensex TRI
*Risk-free rate assumed to be 6.85% (FBIL OVERNIGHT MIBOR as on 31st January 2024). Ratios calculated on the basis of 3 years history of monthly data.
^Portfolio Turnover ratio is calculated as Lower of purchase or sale during the period / Average AUM for the last one year (includes Fixed Income securities and Equity derivatives).
§With effect from 13th March 2023, the name of "IDFC S&P BSE Sensex ETF" has changed to "Bandhan S&P BSE Sensex ETF"
