Bandhan Small Cap Fund§
(formerly Bandhan Emerging Businesses Fund)
Small Cap Fund - An open ended equity scheme predominantly investing in small cap stocks

Bandhan Small Cap Fund§
(formerly Bandhan Emerging Businesses Fund)
Small Cap Fund - An open ended equity scheme predominantly investing in small cap stocks
|
|
|
|
|

|


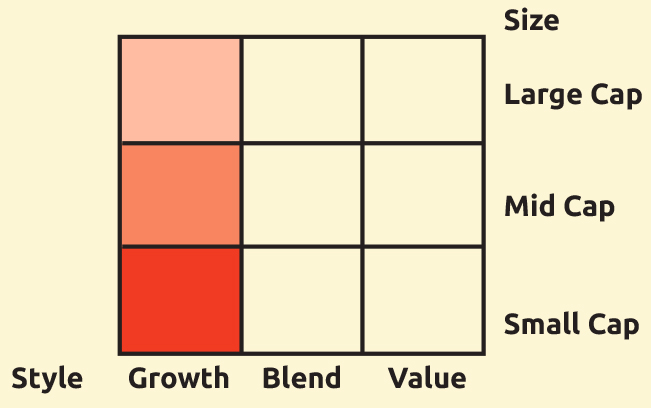
About the Fund:Bandhan Small Cap Fund focuses on building a diversified portfolio within the small cap segment. The fund follows a 3-pronged stock selection approach of Quality, Growth, and Reasonable Valuation.
Category: Small Cap Fund
 : ₹ 3,536.61 Crores
AUM or assets under management refers to the recent / updated cumulative market value of investments managed by a mutual fund or any investment firm.
: ₹ 3,880.25 Crores
AUM or assets under management refers to the recent / updated cumulative market value of investments managed by a mutual fund or any investment firm.
:
An employee of the asset management company such as a mutual fund or life insurer, who manages investments of the scheme. He is usually part of a larger team of fund managers and research analysts.
Other Parameter:
| Beta
Beta is a measure of an investment's volatility vis-a-vis the market. Beta of less than 1 means that the security will be less volatile than the market. A beta of greater than 1 implies that the security's price will be more volatile than the market. | 0.86 |
| R Square | 0.86 |
| Standard Deviation (Annualized)
Standard deviation is a statistical measure of the range of an investment's performance. When a mutual fund has a high standard deviation, its means its range of performance is wide, implying greater volatility. | 16.46% |
| Sharpe*
The Sharpe Ratio, named after its founder, the Nobel Laureate William Sharpe, is a measure of risk-adjusted returns. It is calculated using standard deviation and excess return to determine reward per unit of risk. | 1.41 |
| Portfolio Turnover | |
| Equity | 0.92 |
| Aggregate^ | 0.92 |
| Total Expense Ratio | |
| Regular | 1.84% |
| Direct | 0.30% |
SIP (Minimum Amount): ₹ 100/- and in multiples of Rs.1 thereafter
SIP Frequency: Monthly/Quarterly (w.e.f. 09-11-2022)
SIP Dates (Monthly/Quarterly)@@: Investor may choose any day of the month except 29th, 30th and 31st as the date of instalment.
Investment Objective: Click here
Minimum Investment Amount : ₹ 1,000/- and any amount thereafter
Option Available: The Scheme offer IDCW@ Option & Growth Option. IDCW@ Option under each Plan further offers of choice of Payout & Sweep facilities.
:
Exit load is charged at the time an investor redeems the units of a mutual fund. The exit load is deducted from the prevailing NAV at the time of redemption. For instance, if the NAV is ₹ 100 and the exit load is 1%, the redemption price would be ₹ 99 per unit.
NAV (₹) as on December 29, 2023
| Regular Plan | Growth | 32.77 |
| Regular Plan | IDCW@ | 28.10 |
@@If SIP day falls on a non-business day, the SIP transaction shall be processed on the next business day.
^^Ms. Ritika Behera will be managing for Equity overseas investment portion of the scheme w.e.f. October 07, 2023.
| Name | % of NAV |
| Equity and Equity related Instruments | 91.57% |
| Finance | 14.27% |
| oREC | 2.25% |
| oCholamandalam Financial Holdings | 1.93% |
| oPower Finance Corporation | 1.73% |
| oManappuram Finance | 1.67% |
| PNB Housing Finance | 1.13% |
| Shriram Finance | 0.95% |
| Fedbank Financial Services | 0.75% |
| Satin Creditcare Network | 0.67% |
| Ujjivan Financial Services | 0.59% |
| IIFL Finance | 0.54% |
| Home First Finance Company India | 0.49% |
| Indian Renewable Energy Development Agency | 0.42% |
| Mas Financial Services | 0.38% |
| Repco Home Finance | 0.37% |
| IDFC | 0.35% |
| Rane Holdings | 0.06% |
| Industrial Products | 6.89% |
| oShaily Engineering Plastics | 1.54% |
| RHI Magnesita India | 0.79% |
| Godawari Power And Ispat | 0.63% |
| Carborundum Universal | 0.62% |
| Kirloskar Brothers | 0.61% |
| Graphite India | 0.60% |
| JTL Industries | 0.52% |
| KEI Industries | 0.52% |
| R R Kabel | 0.31% |
| Finolex Cables | 0.30% |
| Finolex Industries | 0.27% |
| SHIVALIK BIMETAL CONTROLS | 0.18% |
| Pharmaceuticals & Biotechnology | 5.57% |
| Piramal Pharma | 0.80% |
| Abbott India | 0.77% |
| Suven Pharmaceuticals | 0.56% |
| Neuland Laboratories | 0.54% |
| FDC | 0.54% |
| Aurobindo Pharma | 0.53% |
| JB Chemicals & Pharmaceuticals | 0.49% |
| Innova Captab | 0.36% |
| Gland Pharma | 0.30% |
| Blue Jet Healthcare | 0.27% |
| Glenmark Life Sciences | 0.26% |
| Concord Biotech | 0.16% |
| Auto Components | 5.56% |
| oTVS Holdings | 1.43% |
| Wheels India | 0.81% |
| Lumax Auto Technologies | 0.64% |
| Alicon Castalloy | 0.63% |
| Exide Industries | 0.62% |
| JK Tyre & Industries | 0.45% |
| Steel Strips Wheels | 0.36% |
| CIE Automotive India | 0.32% |
| Amara Raja Energy & Mobility | 0.30% |
| Capital Markets | 5.48% |
| Computer Age Management Services | 1.20% |
| Motilal Oswal Financial Services | 1.14% |
| Angel One | 1.11% |
| Multi Commodity Exchange of India | 0.91% |
| BSE | 0.70% |
| ICICI Securities | 0.43% |
| Consumer Durables | 4.15% |
| Senco Gold | 1.00% |
| Mayur Uniquoters | 0.92% |
| Greenply Industries | 0.72% |
| Blue Star | 0.51% |
| Stove Kraft | 0.51% |
| Greenpanel Industries | 0.36% |
| Butterfly Gandhimathi Appliances | 0.13% |
| Textiles & Apparels | 3.70% |
| oArvind | 2.20% |
| Nitin Spinners | 1.33% |
| Kewal Kiran Clothing | 0.16% |
| Electrical Equipment | 3.67% |
| oApar Industries | 2.12% |
| Suzlon Energy | 0.50% |
| Hitachi Energy India | 0.44% |
| Rishabh Instruments | 0.35% |
| Inox Wind | 0.26% |
| Commercial Services & Supplies | 3.27% |
| oeClerx Services | 1.52% |
| Quess Corp | 0.89% |
| Updater Services | 0.85% |
| Banks | 3.20% |
| The Karnataka Bank | 1.11% |
| Bank of India | 0.71% |
| DCB Bank | 0.61% |
| Indian Bank | 0.55% |
| RBL Bank | 0.23% |
| Realty | 3.19% |
| Kolte - Patil Developers | 0.90% |
| Sobha | 0.80% |
| SignatureGlobal (India) | 0.68% |
| Swan Energy | 0.48% |
| Name | % of NAV |
| Keystone Realtors | 0.20% |
| Sunteck Realty | 0.14% |
| Chemicals & Petrochemicals | 2.81% |
| PCBL | 1.03% |
| Vishnu Chemicals | 0.60% |
| Chemplast Sanmar | 0.56% |
| NOCIL | 0.36% |
| Fine Organic Industries | 0.26% |
| Retailing | 2.39% |
| Info Edge (India) | 1.04% |
| Zomato | 0.72% |
| Aditya Birla Fashion and Retail | 0.37% |
| V-Mart Retail | 0.19% |
| Electronics Mart India | 0.07% |
| Cement & Cement Products | 2.31% |
| JK Lakshmi Cement | 0.97% |
| Grasim Industries | 0.74% |
| Orient Cement | 0.35% |
| Nuvoco Vistas Corporation | 0.25% |
| Ferrous Metals | 2.29% |
| oKirloskar Ferrous Industries | 1.35% |
| Jindal Stainless | 0.94% |
| Healthcare Services | 1.70% |
| Krishna Institute of Medical Sciences | 0.51% |
| Krsnaa Diagnostics | 0.42% |
| Yatharth Hospital And Trauma Care Services | 0.41% |
| Narayana Hrudayalaya | 0.35% |
| Transport Services | 1.58% |
| The Great Eastern Shipping Company | 0.87% |
| VRL Logistics | 0.69% |
| Transport Corporation of India | 0.03% |
| IT - Services | 1.53% |
| Cyient | 1.06% |
| Affle (India) | 0.46% |
| Power | 1.48% |
| NLC India | 1.01% |
| CESC | 0.46% |
| Diversified | 1.36% |
| Godrej Industries | 1.04% |
| DCM Shriram | 0.32% |
| Beverages | 1.23% |
| Radico Khaitan | 1.23% |
| Petroleum Products | 1.15% |
| Hindustan Petroleum Corporation | 0.77% |
| Gulf Oil Lubricants India | 0.39% |
| IT - Software | 1.07% |
| Birlasoft | 1.07% |
| Agricultural Food & other Products | 0.98% |
| Triveni Engineering & Industries | 0.98% |
| Food Products | 0.92% |
| Heritage Foods | 0.48% |
| Avanti Feeds | 0.44% |
| Leisure Services | 0.90% |
| Yatra Online | 0.53% |
| Westlife Foodworld | 0.37% |
| Oil | 0.89% |
| Oil India | 0.89% |
| Industrial Manufacturing | 0.82% |
| Kaynes Technology India | 0.66% |
| Syrma SGS Technology | 0.16% |
| Consumable Fuels | 0.71% |
| Coal India | 0.71% |
| Minerals & Mining | 0.67% |
| MOIL | 0.67% |
| Aerospace & Defense | 0.67% |
| Bharat Dynamics | 0.67% |
| Construction | 0.65% |
| NCC | 0.34% |
| Kalpataru Projects International | 0.25% |
| Power Mech Projects | 0.06% |
| Entertainment | 0.64% |
| Zee Entertainment Enterprises | 0.64% |
| Non - Ferrous Metals | 0.61% |
| National Aluminium Company | 0.61% |
| Paper, Forest & Jute Products | 0.56% |
| Century Textiles & Industries | 0.56% |
| Transport Infrastructure | 0.53% |
| GMR Airports Infrastructure | 0.53% |
| Personal Products | 0.51% |
| Emami | 0.51% |
| Household Products | 0.45% |
| Jyothy Labs | 0.45% |
| Gas | 0.38% |
| Gujarat State Petronet | 0.38% |
| Automobiles | 0.36% |
| Landmark Cars | 0.36% |
| Agricultural, Commercial & Construction Vehicles | 0.28% |
| Jupiter Wagons | 0.28% |
| Cigarettes & Tobacco Products | 0.22% |
| Godfrey Phillips India | 0.22% |
| Net Cash and Cash Equivalent | 8.43% |
| Grand Total | 100.00% |
| oTop 10 Equity Holdings |
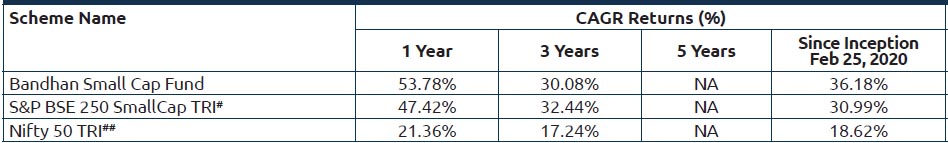
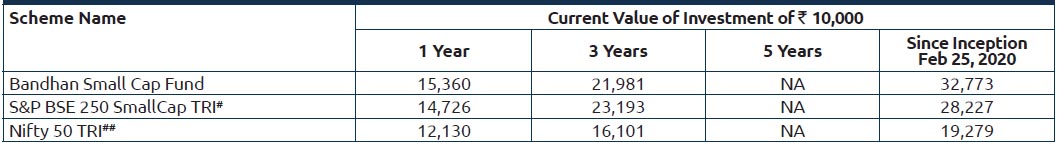
The scheme has been in existence for more than 1 year but less than 5 years. Performance based on NAV as on 29/12/2023. Past performance may or may not be sustained in future.
The performances given are of regular plan growth option.
Click here for other funds managed by the fund manager and refer to the respective fund pages
#Benchmark Returns. ##Alternate Benchmark Returns.
Scheme risk-o-meter
Investors understand that their principal will be at Very High risk
This product is suitable for investors who are seeking*
- To create wealth over long term.
- Investment in equity and equity related instrument of small cap companies.
* Investors should consult their financial advisers if in doubt about whether the product is suitable for them.
Benchmark risk-o-meter
S&P BSE 250 SmallCap TRI
Regular and Direct Plans have different expense structure. Direct Plan shall have a lower expense ratio excluding distribution expenses, commission expenses etc.
^Portfolio Turnover ratio is calculated as Lower of purchase or sale during the period / Average AUM for the last one year (includes Fixed Income securities and Equity derivatives).
Mr. Anoop Bhaskar was managing this Scheme till 27th January 2023.
§With effect from 13th March 2023, the name of "IDFC Emerging Businesses Fund" has changed to "Bandhan Small Cap Fund"
Ms. Ritika Behera has been designated as the dedicated fund manager for managing the overseas exposure in equity segment for all equity oriented schemes and hybrid schemes of Bandhan Mutual Fund ("the Fund") with effect from October 07, 2023.
