Commentary

Commentary
|
|
|
|
|

|


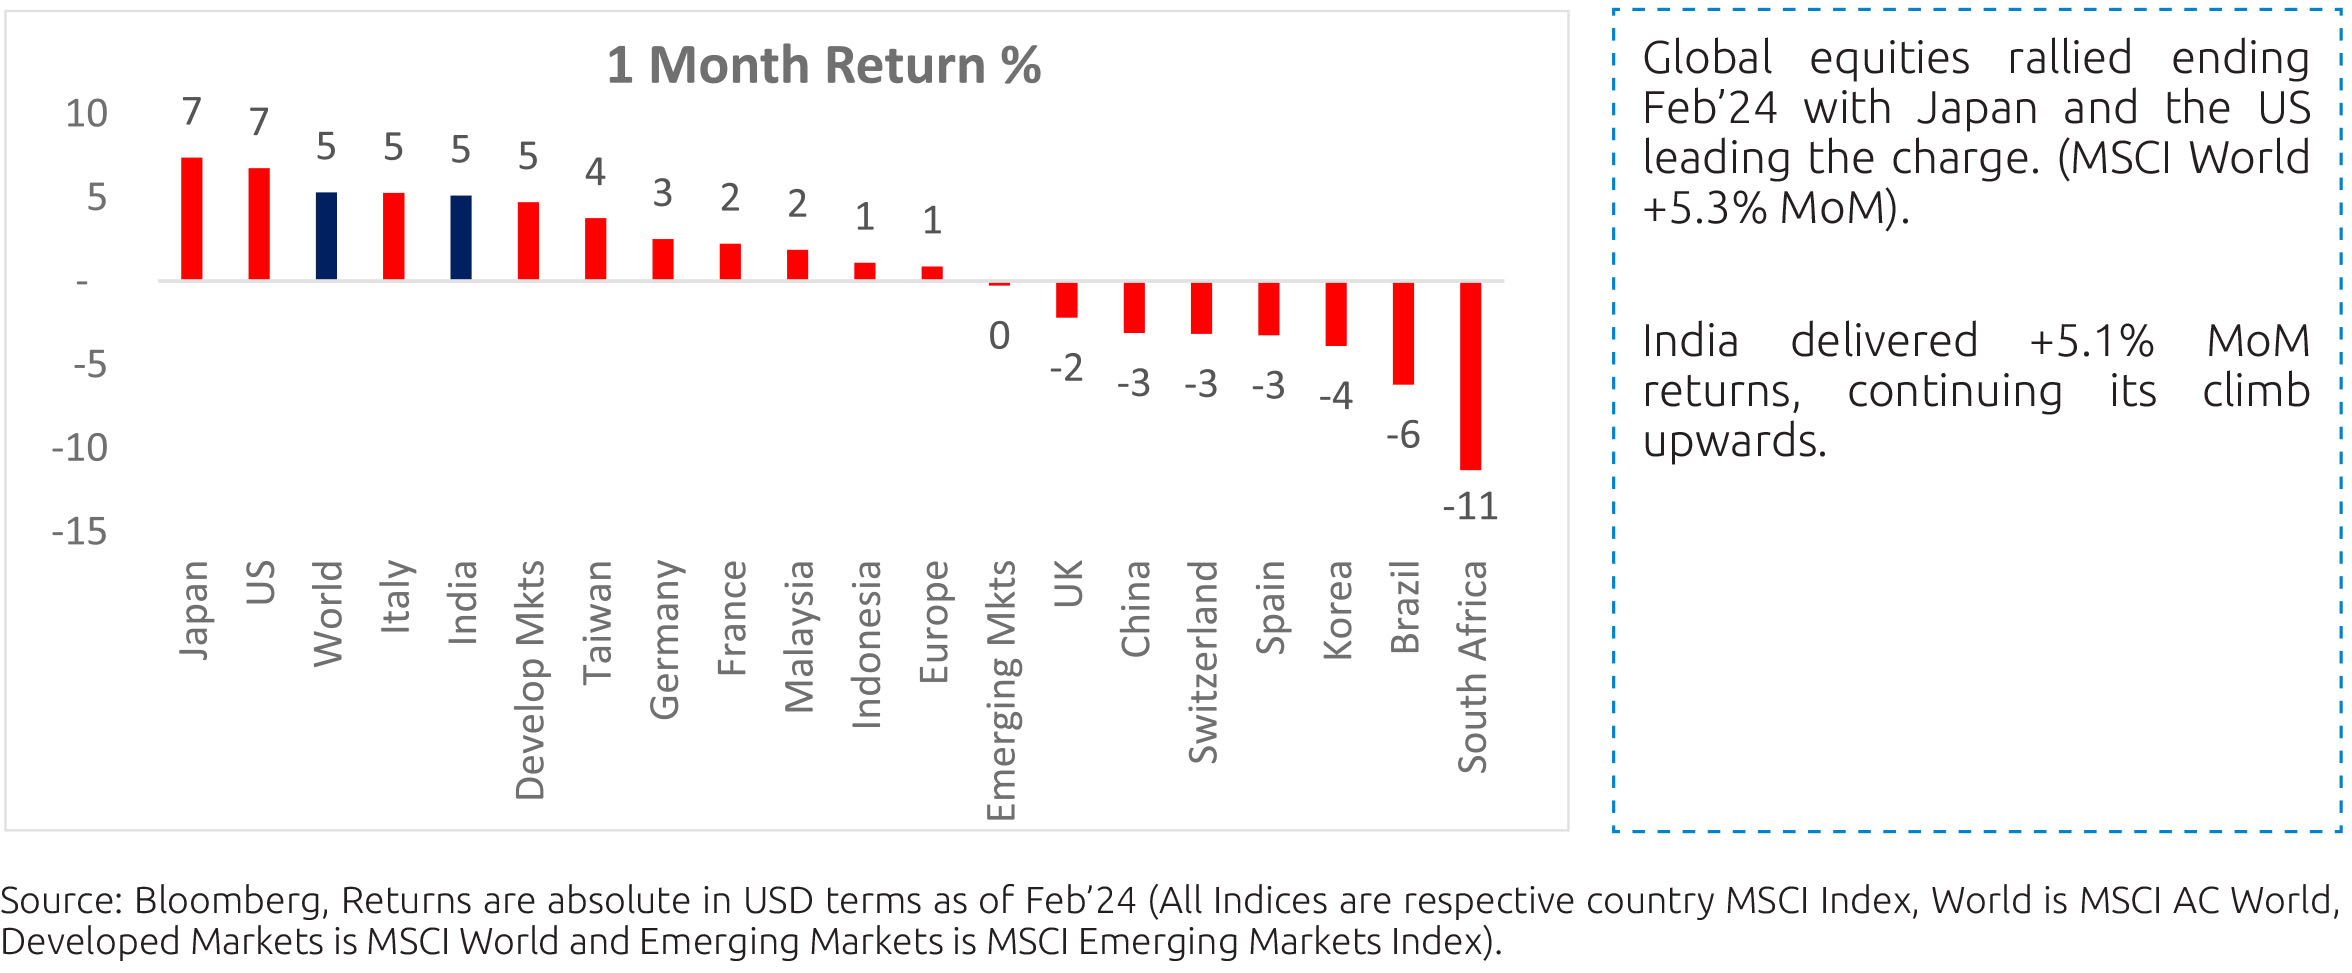
How has the global market performed?
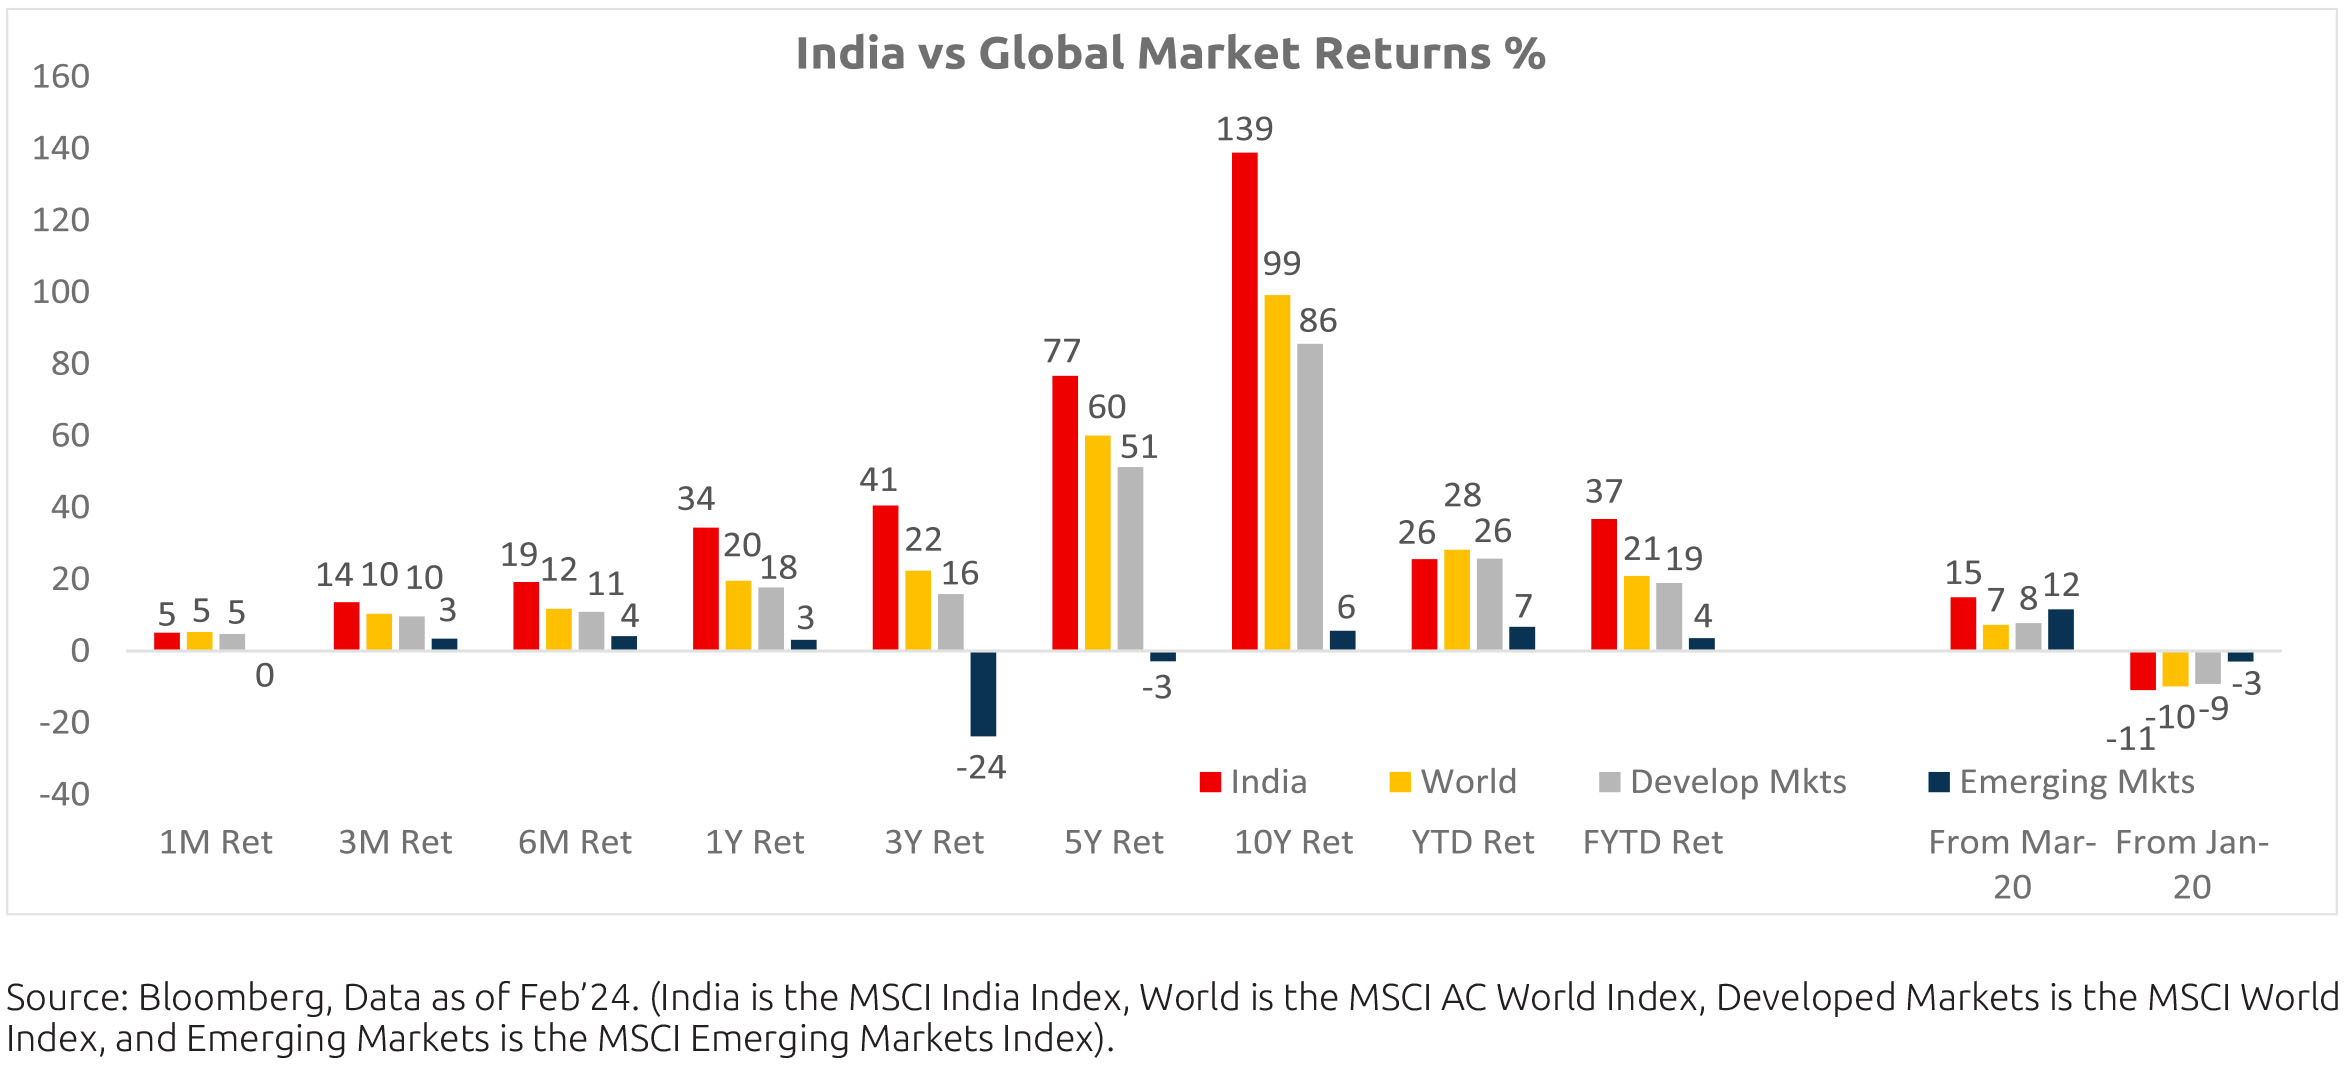
Comparative: India extends it lead over the 1Y returns and leads the pack across all other horizons and geographies.
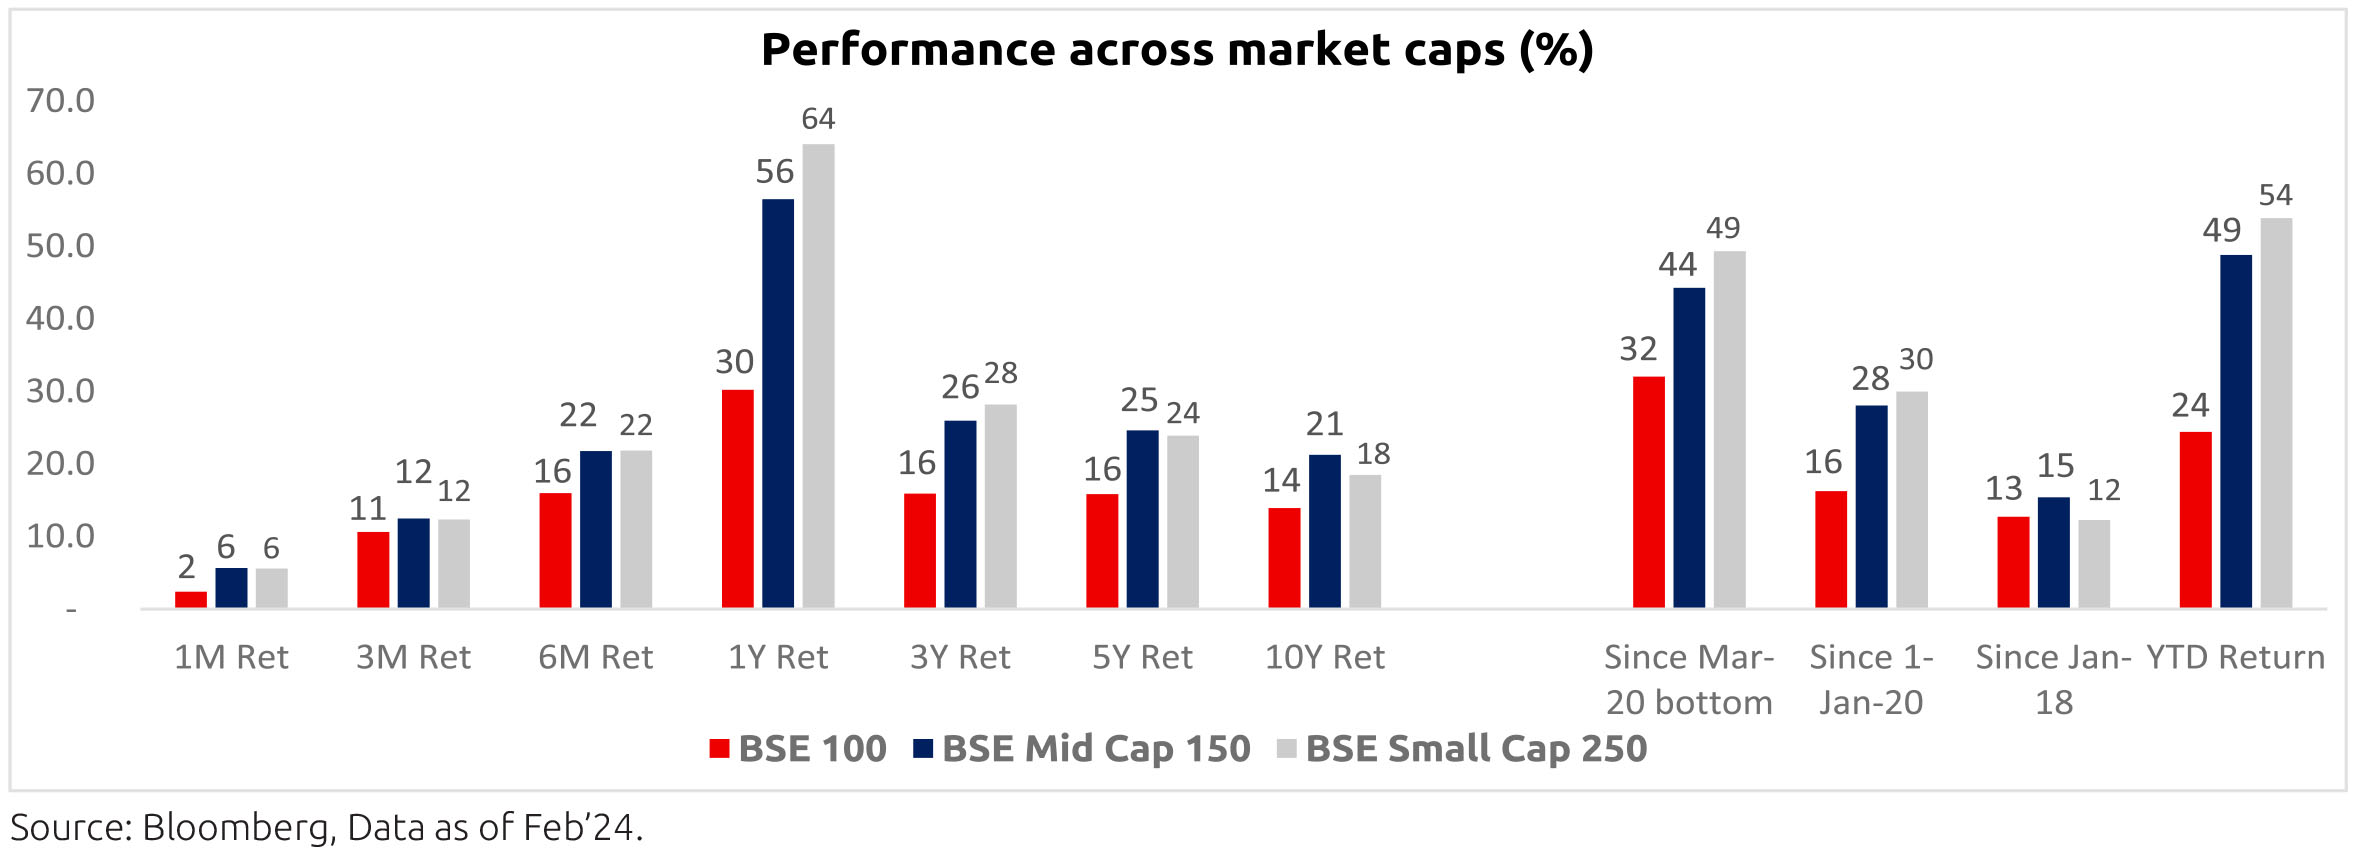
How has the Indian Market performed?
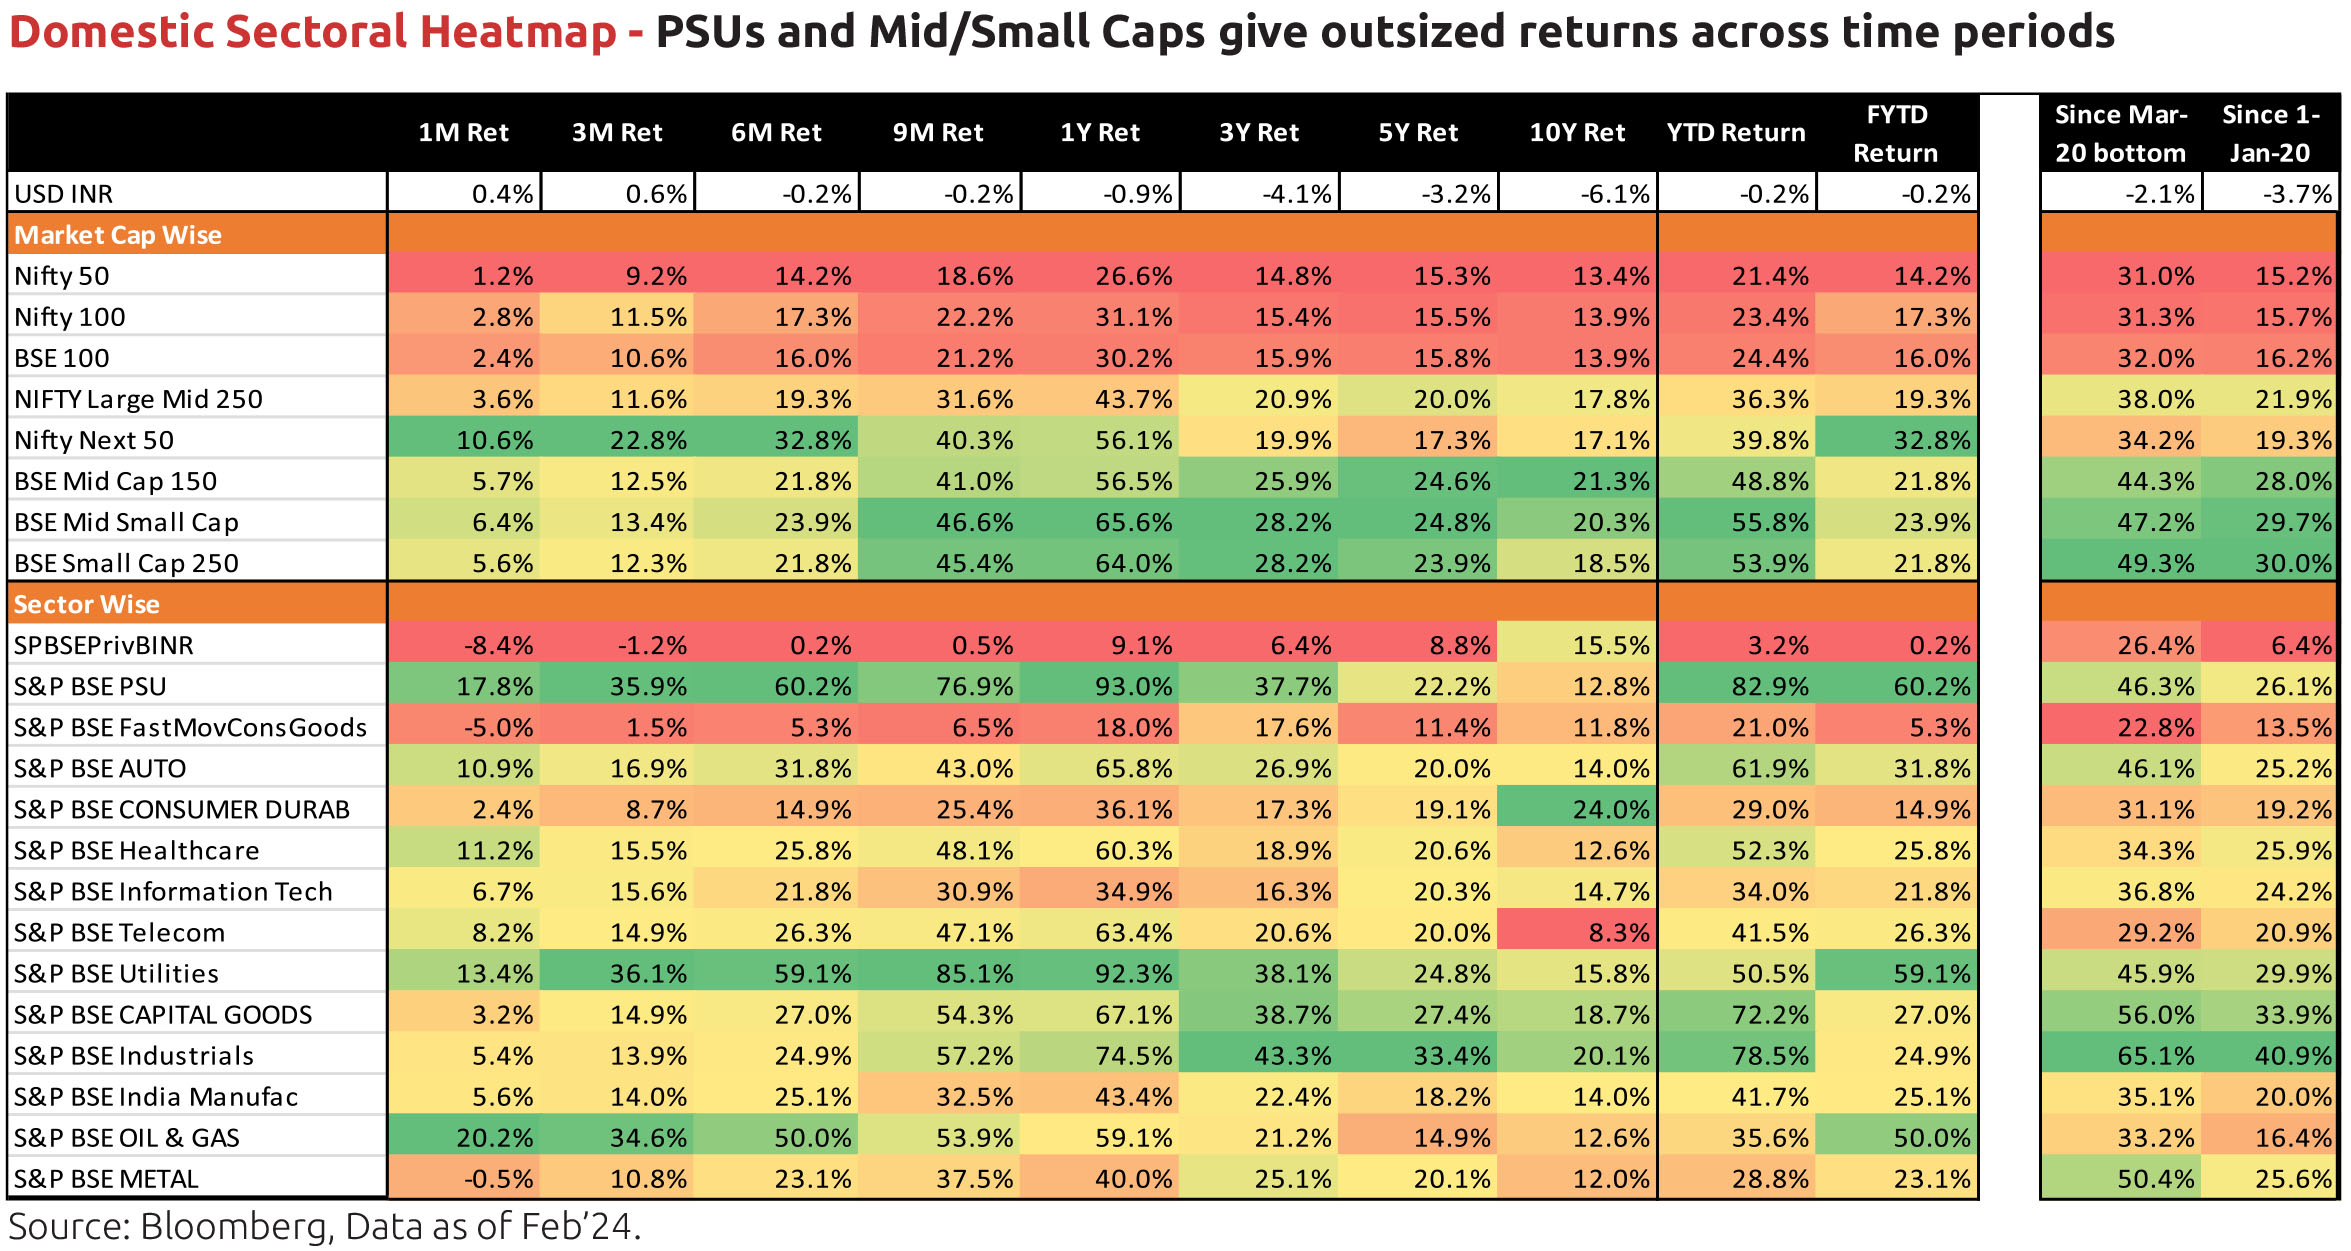
EQUITY OUTLOOK
The market has been volatile recently - one of the factors being that globally the expectation that interest rates
will fall swiftly is now being pushed back as global growth and inflation are still strong. Given the steep run global
markets have witnessed since Nov'23, some consolidation is expected. On the domestic side, we are now seeing
mid/small cap indices underperforming the large cap index after almost a year.We believe the strong macro-economic outlook of India especially on the current account side will lead to risk premium on Indian assets going down which translates to higher valuations. This is of course assuming no tail risks materializing. We continue to be overweight on domestic sectors vs global sectors.
As per the latest estimates of National Income, India's real GDP is poised to grow 7.6% y/y in FY24, up from 7.3% estimated
previously and after 7% (revised down from 7.2%) in FY23. The biggest driver of this is investments, mainly government capital
expenditure, even as private consumption growth is expected to slow to 3%, down from 4.4% estimated previously and 6.8%
in FY23. By sector, growth in agriculture and allied sectors is to slow to 0.7% y/y in FY24 (lowest since FY16) but manufacturing
growth has been revised higher (6.5% to 8.5%) and services growth is estimated at 7.5%. Real GDP in Q3 FY24 grew 8.4%, well
above expectation, but real GVA grew only 6.5% (closer to expectations). This was because 'Net Taxes on Products', included in
calculation of GDP and not of GVA, was up 32% y/y because indirect taxes picked up and subsidies fell sharply in y/y terms in Q3.
This implies a 5.9% y/y GDP growth rate in Q4 FY24.
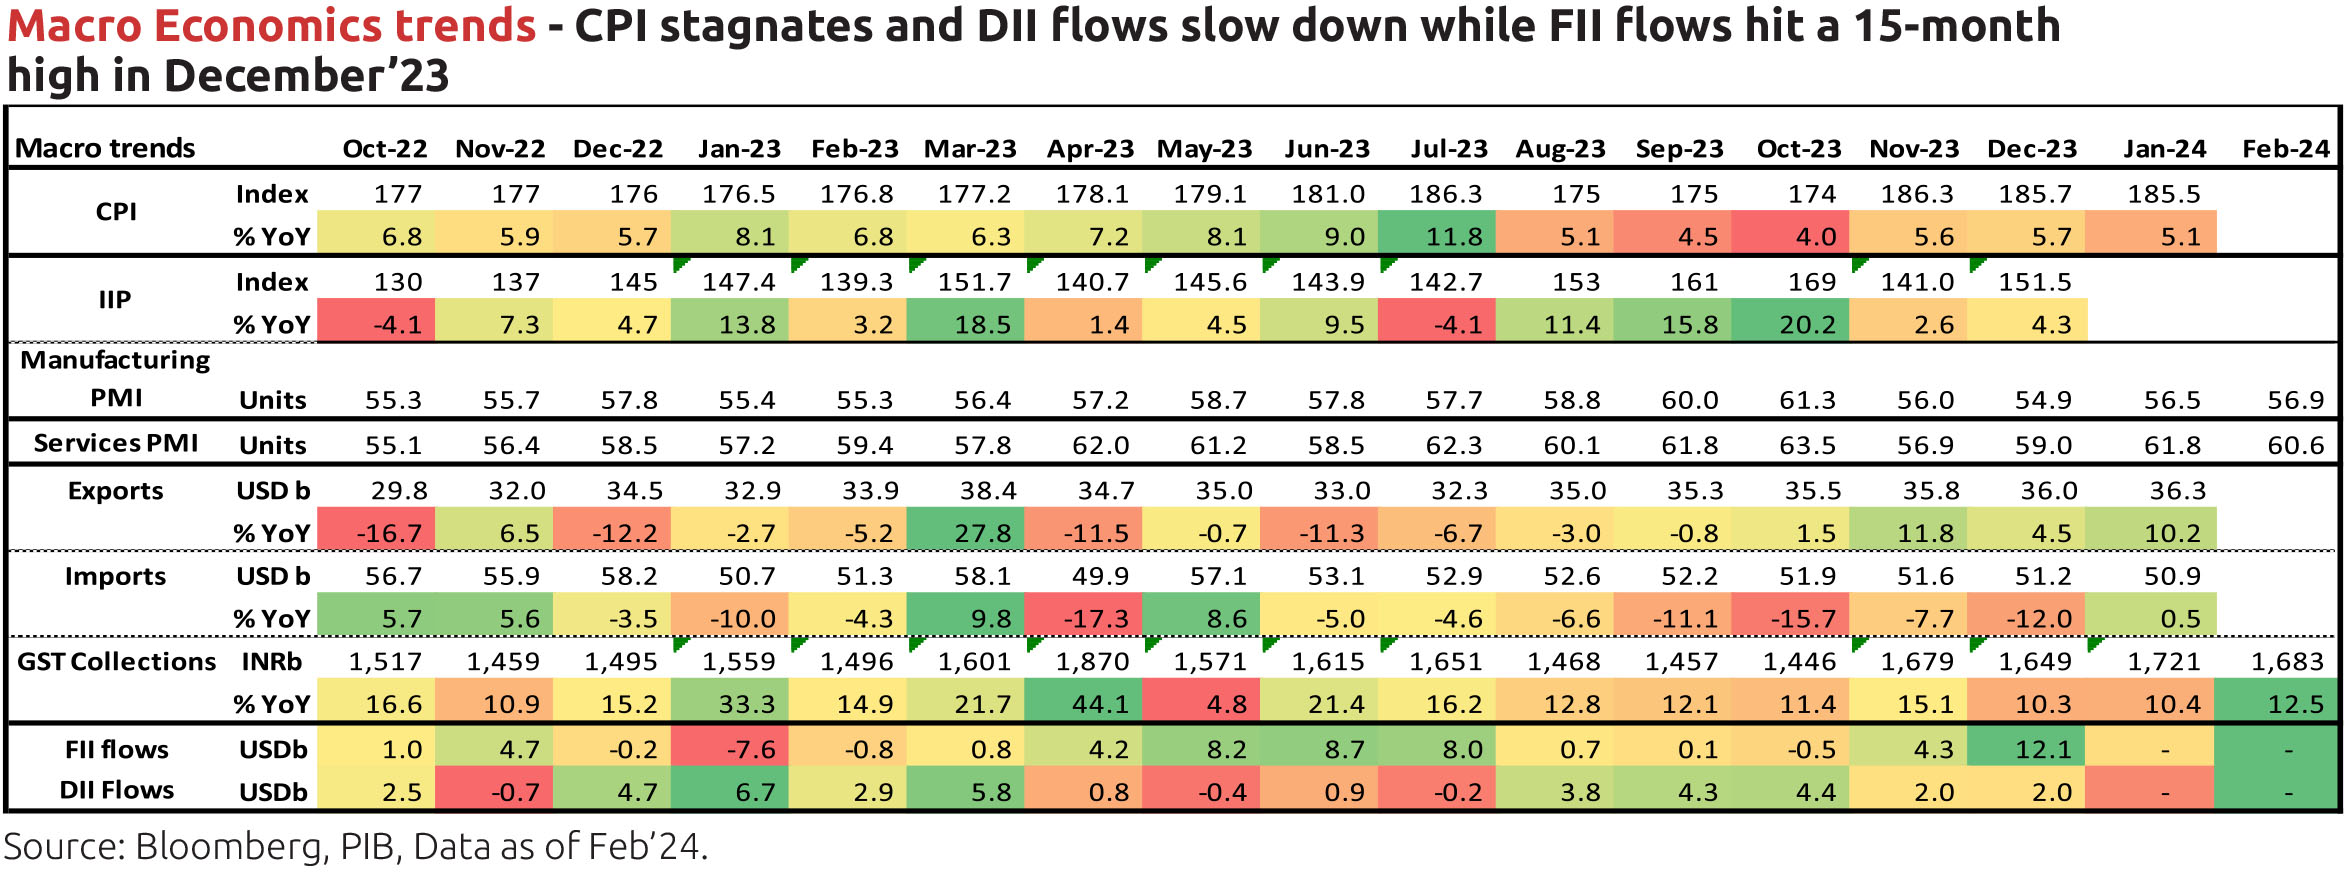
As per the central government fiscal data for April-January, net tax revenue growth was up 11.3% y/y, as direct tax collections picked up but so did devolution of taxes to states. Total expenditure was up 5.9% y/y, with revenue expenditure up only 1.4% and capital expenditure up 26.5%. Fiscal deficit so far is 63.6% of the revised estimate for FY24 vs. 68.5% during the same period last year (latter as % of actuals). In terms of financing the fiscal deficit, small savings collection was stronger by around Rs. 86,000cr from the same period of last year. In February, GST collection was at Rs. 1.68 lakh crore and 12.5% y/y.
India's Consumer Price Index (CPI) inflation eased to 4.9% y/y in October but the sequential momentum in food and beverages picked up in October and November, driven by vegetables, pulses, eggs, etc. Thus, November CPI increased to 5.6% and December CPI was at 5.7% but the latter reading was marked by an underlying easing in food price momentum. January CPI eased to 5.1% as food prices fell further. Core inflation (CPI excluding food and beverages, fuel and light), which averaged 6.1% in FY23, has been moderating and eased further to 3.6% y/y in January. Real time prices of tomato, wheat and vegetable oils are now easing but that of pulses are inching back up. Winter disinflation of vegetables should also start reversing now. However, wheat harvest and procurement from the rabi crop season has started and the government has been taking various supply side measures related to procurement, open market sales, international trade, price rise mitigation, etc. Global weather forecasting agencies predict El Niño (typically associated with lesser rainfall in India and thus lower agriculture production) to continue till April-May.
Industrial production (IP) growth was 3.8% y/y in December after 2.4% in November. On a seasonally adjusted month-onmonth basis, it was +0.8% in December after -0.7% in November. Output momentum stayed negative for primary, capital and intermediate goods and it tuned negative for consumer durable goods. It picked up for consumer non-durable goods and infrastructure & construction goods. Infrastructure Industries output (40% weight in IP) momentum stayed flat (seasonally adjusted) in January, as output momentum weakened sharply for petroleum products, cement and fertilizers while it improved for coal, crude oil, steel and electricity.
Bank credit outstanding as on 09th February was 20.3% y/y, including the impact of the merger of a non-bank with a bank from 01 July 2023. Latest bank deposit growth is at 13.6%. Credit flow in FY23 was much higher than in the previous two financial years with strong flows to personal loans (38% of total flow) and services (33% of total flow). Credit flow in FY24 (April-January) has also been higher towards personal loans and services. As at end of January 2024, growth of credit outstanding as personal loans grew 29% y/y and that to services grew 24% while that to industry grew only 8.3%. On 16th November, the RBI raised risk weights for commercial banks' and NBFCs' categories of unsecured personal loans (including bank credit to NBFCs).
Merchandise trade deficit for January eased further to USD 17.5bn from USD 19.8bn in December and the sharp rise to USD 30bn in October. In January, oil trade deficit increased only mildly by USD 0.3bn m/m, gold imports were down by USD 1.1bn and non-oil-non-gold imports fell by USD 4.4bn. However, non-oil exports fell by USD 2.9bn. Services trade surplus (which surprised to the upside from late 2022 with an average monthly surplus of USD 13.2bn in H2 FY23 vs. USD 10.9bn in H1 FY23) was at USD 16.8bn in January after USD 16bn in December. It has averaged USD 13.8bn so far in FY24.
Among higher-frequency variables, number of two-wheelers registered picked up sharply in November (due to the festive season), moderated from December and has recovered a bit from mid-February. Energy consumption levels averaged just 0.1% y/y during the week ending 06 March 2024. Monthly number of GST e-way bills was 9.5cr units in December (after 8.8cr in November) and averaged 9.4cr in the December quarter.
US headline CPI was at 3.1% y/y in January, after 3.4% in December. In January, price momentum increased in Food and beverages, Medical care, Recreation, Education & Communication, Other goods & services, Owner's equivalent rent of residence and thus overall Services category. Momentum was negative in energy, apparel and overall goods category. Core CPI was at 3.9% y/y in December and January after 4% in October and November. Sequential momentum in headline CPI, core CPI and non-housing-core-services increased. Given certain seasonality factor issues in data at the beginning of the year and change in methodology of calculation for some components, it is important to keep tabs on upcoming inflation prints as well. US non-farm payroll addition in January (353,000 persons) was well above expectation and numbers for the recent months were revised up too. Growth in average hourly earnings increased to 0.6% m/m in January but that in average weekly earnings fell as the average weekly hours worked fell. The unemployment rate stayed flat at 3.7% and the labour force participation rate at 62.5%. Non-farm job openings as per the Job Openings and Labor Turnover Survey (JOLTS) was almost flat in December and January, with hires and quits easing very mildly in January. The job-opening-to-hires ratio for the non-farm sector is now 1.56, off the peak of 1.84 in March 2022 but higher than the pre-pandemic average of 1.18 in Jan-Feb 2020.
The FOMC (Federal Open Market Committee), left its policy rate unchanged again at its meeting in January (after doing the same since September) at 5.25-5.50%. The last hike was in July and it had hiked rates at every meeting from March 2022 to May 2023. However, the December 2023 meeting marked a pivot in the Fed's policy from potentially hiking rates further to likely no more hikes and to even discussing rate cuts this year. At the January meeting, it said economic activity was continuing to expand at a solid pace, employment and inflation goals are moving into better balance but that it does not expect it will be appropriate to reduce the target range until it has gained greater confidence that inflation is moving sustainably toward 2%. The Fed Governor thus stressed on the need to see more good inflation data (same pace of disinflation seen in the last six months). Thus, although a 75bps rate cut is expected this year as per the Committee's Summary of Economic Projections from December 2023, the Governor said it will be unlikely the Committee will reach a level of confidence by the March meeting to start cutting rates. He also said the committee had some discussions this meeting on tapering the ongoing reduction of the Fed's balance sheet (i.e. tapering Quantitative Tightening) and that it plans to begin in-depth discussions on this in the March meeting.
Outlook
For investors who have the mandate, the flat curve shouldn't come in the way of owing long duration bonds. The approach now has to be participative rather than tactical in our very strong view. We say this because we hear a lot of duration calls being anchored to expected rate cuts, just as they have always been in the past. This ignores the transformation underway. Also, within one's allowed mandate one has to start taking the prospect of reinvestment risk much more seriously. Thus, as an example, one shouldn't be too distracted with carry on offer currently if the duration of the investment (time to maturity or next reset of coupon) is short enough to expose one to future reinvestment risks even within the allowed respective investment mandates.
On our part, we are implementing this in two ways: One, in our active duration funds we continue to be overweight 30 year government bonds. Two, we increasingly find tactical roll down strategies as being less persuasive given that they expose investors to natural reinvestment risk, and are accordingly making suitable changes.
Data Source: CEIC, PIB, US Federal Reserve, Bandhan MF Research. Data as on latest available
